Calibrating launch performance for the iPhone in China

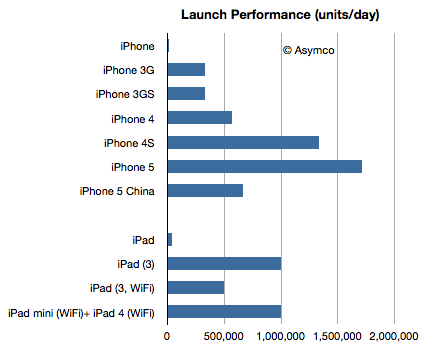
When the iPhone 5 launched Apple promised availability in 100 countries before the end of year. This was a very aggressive plan given the gradual release of previous products. Last year the iPhone 4S only arrived in China (along with 21 additional countries) on January 13th. This year it was almost a month earlier.

Apple also announced for the first time this year first weekend sales for China: 2 million. This is, as far as I know, the first weekend sales data for a single market outside of the US. The time span was three days and therefore the daily sales rate was 2/3 million per day.

The following chart compares the launch performance for the launches which Apple reported:

Screen Shot 2012-12-17 at 12-17-2.44.04 PM

If we normalize by population, Continue reading “Calibrating launch performance for the iPhone in China”

Below the Surface

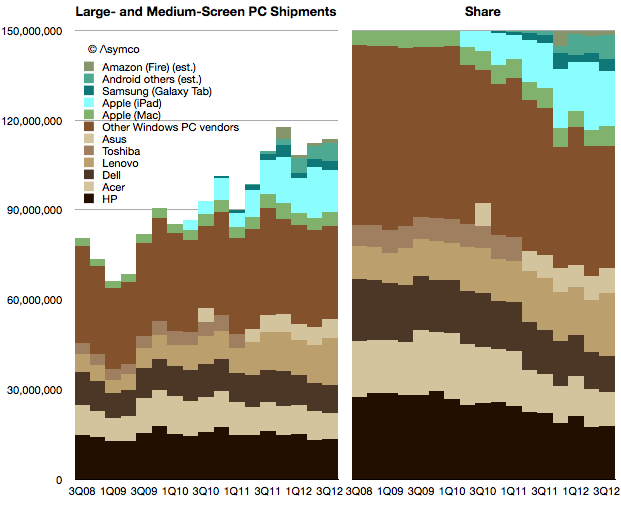
Early data shows that the PC market has not experienced a “pop” from Windows 8. Market watchers have been anticipating this pop since every previous version of Windows has led to a surge in shipments. PC vendors have also been hoping for this to lift their volumes. Volumes have been stagnant for a while, as the following chart shows:

Screen Shot 2012-12-13 at 12-13-3.45.58 PM

If we combine the traditional PC and tablet markets—what I refer to as “large and medium screen PCs”— there has been growth. However the growth is all due to the tablets. When seen in a share split (blue tablets vs. brown Windows PC’s) the shift toward tablet computing is clear. Continue reading “Below the Surface”

Does S stand for Spring?

John Sculley:

“I think they’re going through a very significant change now in terms of product cycles,” Sculley explains. “Traditionally Apple introduces products once a year; now it’s really introducing products twice a year. The complexity of that from a supply chain is immense, and Apple seems to be doing it well. So, I think that people are underestimating just how well Apple is run, and just how successful the company can be when it gets to that twice-a-year product introduction cycle.”

Former Apple CEO John Sculley: Apple is well-run | TUAW – The Unofficial Apple Weblog

Suggesting that Apple is moving to a semi-annual cycle is a very provocative thing to say, but it’s something I’ve also speculated is happening during a Critical Path podcast.  Sculley’s comments prompted me to weigh the possible evidence that this is happening:

  1. All of the major products which Apple sells have been updated in the Fall. This is unprecedented. Not only were product launches scheduled in the spring, historically they had been spread throughout the year. The odds that they happen to coincide by accident are nil. Not only that but the move of iPad and iPhone and iPod and MacBook and iMac to launch all within Fall (once a year) seems risky because it leaves a vast gap for competitors to fill six months hence. Indeed, given the iPhone’s launch predictability, many (most?) competing products already target launching in the Spring.
  2. Launch ramp for iPhone steeper than ever. The number of countries and operators launching the product in the launch quarter is nearly the entire distribution list. This is also the first time this has happened. Not only does it imply a very steep ramp, it indicates no channel fill will be happening past Q1. There will not be incremental sales to unserved customers as the fiscal year wears on.  Continue reading “Does S stand for Spring?”

The cost of selling Galaxies

In the post “Google vs. Samsung” I compared the profits of Google and Samsung Electronics’ mobile (aka Telecoms) division. It showed how Samsung has grown its mobile business to such a degree that, if sustained, could conceivably influence the way Android is controlled.

However, we should not analyze Samsung’s mobile group in isolation of the entire company. Samsung relies on internal transfer of technology and capacities of production which are quite unique for device vendors today. In other words, Samsung is a relatively integrated enterprise. Understanding the whole is necessary before understanding the part.

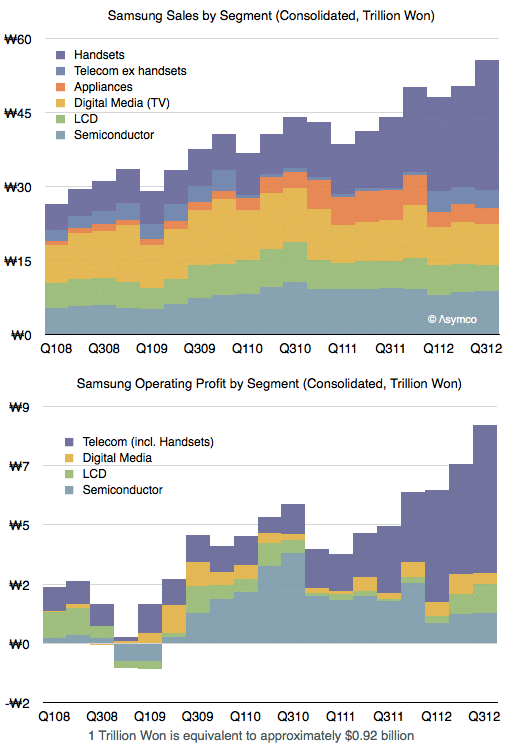
The following graph shows the sales and operating profit for  Samsung Electronics as a composite of its divisions since early 2008.

As one would expect, the mobile group (Telecom) is the source of both top and bottom line growth. The group has also been leading in terms of margins and increasing those margins steadily.  Continue reading “The cost of selling Galaxies”

Validating the Android engagement paradox

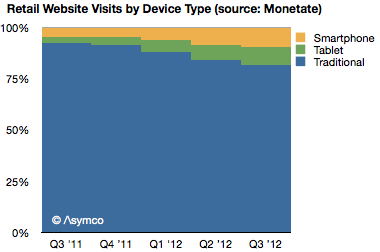
Following yesterday’s IBM data, Monetate released a new study showing similar data related to retail browsing but covering a period of dates from Q3 2011 to Q3 2012.

This data also shows an acceleration of mobile shopping, from 7.7% of online in Q3 2011 to 18.8% in Q3 2012.

It also shows tablets growing to take about half of mobile traffic in a very short time frame.

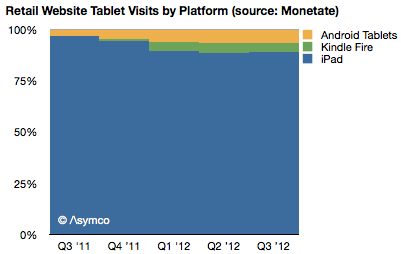
The data also shows the iPad taking the vast bulk of traffic among tablets (88.9% vs. 88.3% from IBM). Continue reading “Validating the Android engagement paradox”

The Android engagement paradox

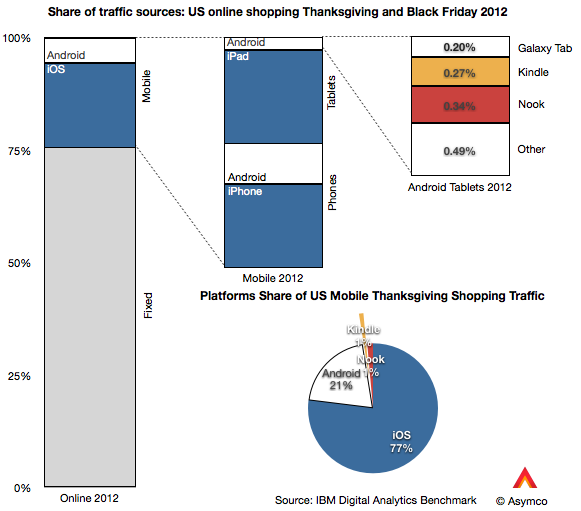
IBM’s Digital Analytics Benchmark reported US Black Friday sales and the news is reasonably good. Overall online sales grew by 17.4% while mobile grew to make up 24% of traffic.

The data goes further to show the split between device types. I illustrate this split with the following graphs:

Of the 24% of traffic made up by mobile devices, phones contributed 13% and tablets 11% (or 54% and 46% of mobile respectively). Of the phone traffic, iOS devices were about two thirds of traffic and Android one third. Of tablet traffic, iPad was 88%, Kindle and Nook were 5.5% Galaxy Tab was 1.8% and other tablets were 4.4%.

Overall, iOS was 77% generated mobile traffic and Android (excl. Kindle, Nook) was 23%.

That’s an interesting snapshot of the consumption of mobile devices, but is there a pattern here? Continue reading “The Android engagement paradox”

The iPhone Addressable Market

The iPhone is a severely constrained product. We’re used to thinking that it’s production constrained—and it is, but it’s also distribution constrained. It has a business model that is almost completely dependent on operator subsidy. Few end users pay the $650 average price that Apple obtains and that price point has held for a remarkably long time. This price point is largely invisible to the user.

In this regard it’s very different from all the other products Apple sells. Historically, the company has preferred having its customers to also be its users and maintained a direct relationship with them, strengthening that relationship through its own retail channel for the last decade. Pricing is used by Apple as a signal to clearly illustrate value to the user and pricing is part of the communication about the product that Apple makes very explicit. This has been true for the iPod and Mac and is still true of the iPad. But this is not so for the iPhone. The entire marketing strategy for the iPhone (and hence the entire product concept itself) is “off message”.

Why is this?

Continue reading “The iPhone Addressable Market”

The beloved hobbies of Google and Amazon

Tim Cook speaking about the Apple TV product:

For Q4 we sold 1.3 million. That is up over a 100% year-on-year. We sold more than 5 million Apple TVs during the fiscal year, which is almost double the previous year, when we sold 2.8 million. So the business continues to do very well, but if you look at the size of revenue of this business versus our other businesses, it’s quite small and so it still has the hobby label, however it’s a beloved hobby and we continue to focus on it and continue to believe there is something more there and continue to pull the string to see where it takes us.

Five million Apple TVs per year is a half-billion dollar hobby. As such it quintupled from the first year (calendar 2007).

Continue reading “The beloved hobbies of Google and Amazon”

The iPhone and Apple's Margins

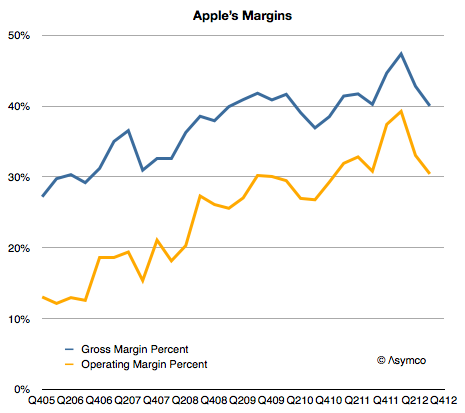
As the following graph shows Apple gross margins and its operating margins have both been on a consistent upward slope since early 2006.

The reason is that the company has moved to more mobile devices as a percent of products shipped. Whereas Macs have had decent margins by the standard of the PC industry, they are not as profitable on a unit basis as iPods, iPhones or iPads. As portable or mobile products grow rapidly, it would follow that margins would as well.

However, the growth is not monotonic. There are occasional dips in gross margins. The cause is the launch of new device versions. On the following graph I show the launch times for the iPhone versions and the company’s gross margin as well as my estimates for iPhone and other product line margins. Continue reading “The iPhone and Apple's Margins”