Positioning Lumia

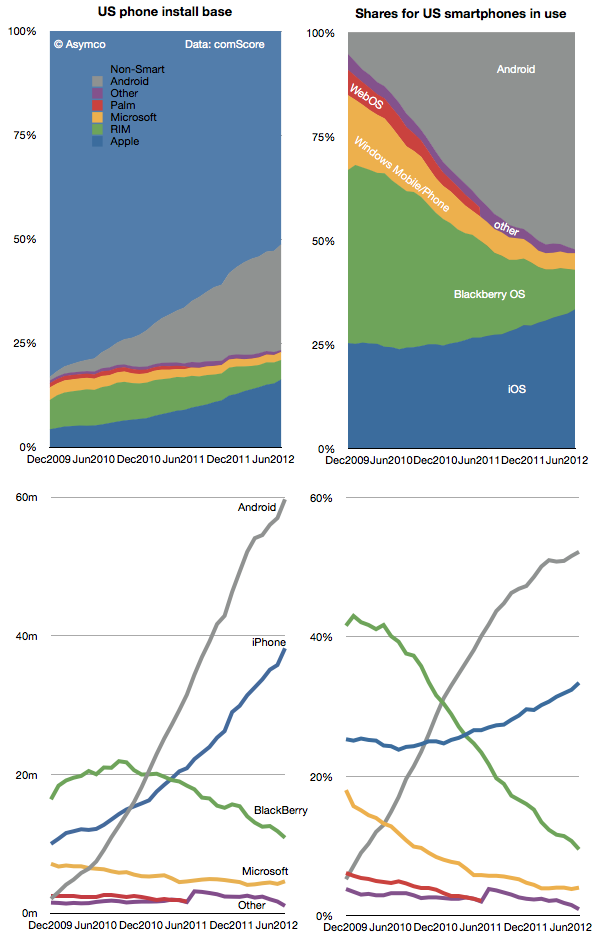
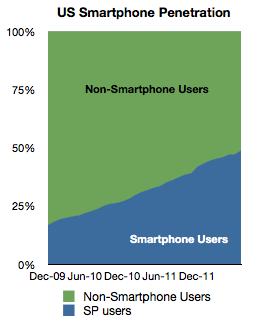
The US has reached 50% smartphone penetration.

comScore data shows July penetration at 48.8% and a monthly growth in penetration of nearly 2 percentage points. Given the rate of growth, it’s nearly certain that we’ve crossed 50% in August.

The historic growth is shown below:

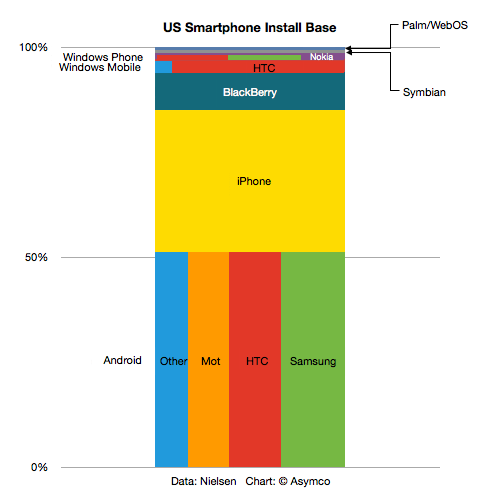
The platforms making up the smartphone market in the US have seen unequal shares of this new population of users. The following diagrams show how the install bases have changed in absolute and share terms.


To round out the analysis, here is the net user gains for the platforms showing the net addition or loss of users since early 2010. Continue reading “Positioning Lumia”

An interview about Microsoft's Surface

This interview was conducted with Bruno Ferrari Editor of Exame magazine in Brazil.

First, do you have forecasts for tablet market share including Microsoft for next years? (Apple, Android, Amazon etc)?

I have some guesses but I don’t think it’s something that is defensible. Too many things can change. Fundamentally I believe Microsoft sees the tablet as a PC and intends to migrate a substantial portion of would-be PC customers to tablet forms. If they are successful then they preserve the existing PC user base and allow it to grow a bit.

In contrast Apple sees the iPad as a new type of device that is used for things not directly related to PC style computing. In that sense the iPad competes with PC non-consumption. It means people may own both a PC and an iPad and some will own only an iPad. The iPad will expand the market while taking share from the PC. Windows tablets will try to hold the Windows share steady.

 How do you analyze Microsoft’s strategy with Microsoft Surface? Don’t you think they’re admitting themselves that Apple was right since the beginning?

We don’t know the strategy yet. Without pricing and an idea of how the other OEMs will respond, I have more questions than answers. The fact that they are doing their own PC hardware does indicate that they see the industry architecture changing and that a large number of vendors offering hardware “choice” is not really the basis of competition in PCs. In other words, buyers are not willing to pay a premium for Windows because the hardware it’s available on is offered in a wide range of options.

Do you think MS growth at tablet market will surpass the lost at PC (desktop and notebook) market in the next years?

Continue reading “An interview about Microsoft's Surface”

How many Kindle Fires were sold?

Last September I argued against the potential of the Kindle Fire acting as a low end disruption in the tablet market.

Now that the first version of the product has reached is end of life, it’s time to review the discussion.

The first problem is finding out how well the product did. Amazon just released a statement that the Fire accounted for 22% of tablet sales in the US in the nine months it was available. The challenge becomes knowing how many total tablets were sold in the US during this time frame.

Fortunately we know the vast bulk of that total based on the Samsung v. Apple trial. Both Apple and Samsung submitted as evidence sales of the iPad and the Tab product lines in the US. The iPad added up to 16.14 million units (Q4’11 through Q2’12) and the Tab was 540k units. That makes the iPad and the Tab add up to about 16.7 million units. Assuming an additional 1 million units for the other (non-Kindle) total yields an estimate of 22.7 million tablet devices sold in the nine months ending June.

Applying the 22% claim to that total gives a Kindle sales total of 4.987 million. That’s awfully close to a round number of 5 million.

Since Amazon admitted that they ended production prior to launching a replacement (and presumably did so quite early in order to drain inventory,) then we can safely assume that the original production order was 5 million units.

Five million Kindle Fire units becomes the first reliable estimate of Kindle sales (based on Apple, Samsung and Amazon supplied information rather than guesses from analysts.) Continue reading “How many Kindle Fires were sold?”

American exceptionalism

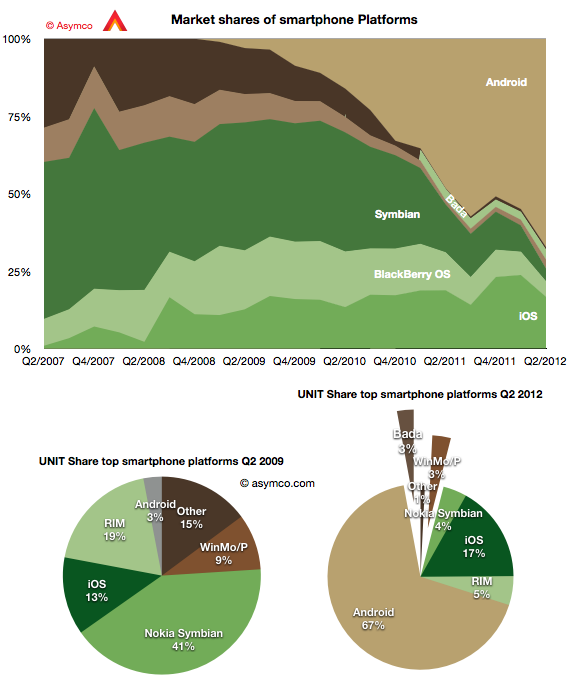
The second quarter showed continuing growth for Android with 19 points of share growth from a year ago. Only Windows Phone showed a gain y/y in share up 1.6 points to about 3%. In the same time, Bada lost half a point, iOS lost 2.1 points, RIM lost 7.2, Symbian 11.4.

The result is shown in the graph below:

I also show a “before-and-after” pair of pie charts which show the difference in smartphone platform market share from the same quarter three years ago. Android went from 3% share to 67% while Symbian went from 41% to 4% and RIM went from 19% to 5%. iOS increased its share from 13% to 17%. Continue reading “American exceptionalism”

Measuring iOS as a gaming platform

At this year’s WWDC Apple offered an update on Game Center accounts. The data we have so far is shown in the following graph.

Before being acquired, another network, OpenFeint, announced 180 million iOS accounts in October 2011. Another figure to consider is the 40 million subscribers to Xbox Live (out of 66 million Xbox users). This subscriber base is paying for a service (about $1 billion per year) so it’s not the same as the free Game Center model.

Rather than being a revenue source, Game Center is designed to engage users and to capture usage information. It also lets us gauge gaming “consumption” on iOS devices. That itself allows us to contemplate it as a gaming platform vis-à-vis alternate platforms.

To consider the figure as a proxy of penetration and engagement, the graphic below shows cumulative sales of gaming devices.[1] Continue reading “Measuring iOS as a gaming platform”

How many iPhone “5''s will be sold?

Phil Schiller stated (under oath) that when assessing sales for a new model of the iPhone, Apple used an easy shorthand:

Each new generation sold approximately equal to all previous generations combined.

That’s a helpful gauge. Did it hold and will it continue to hold?

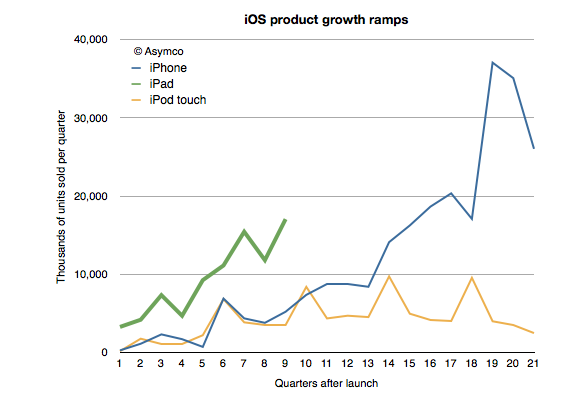
In order to test this rule of thumb we need to know generational sales. Although we know overall unit sales for a given quarter, since Apple has been selling several versions simultaneously, we need to make some guesses about the ratio of generations in the mix. My guess is about 10% for 3G vs. 90% 3GS and 5% 3GS vs. 10% 4 vs. 85% 4S. That results in the following pattern:

The cumulative totals for these generations can then be generated and they appear as follows: Continue reading “How many iPhone “5''s will be sold?”

Estimating third and fourth quarter iOS shipments

In the 2011 Annual Report(10K) published October 26th Apple states:

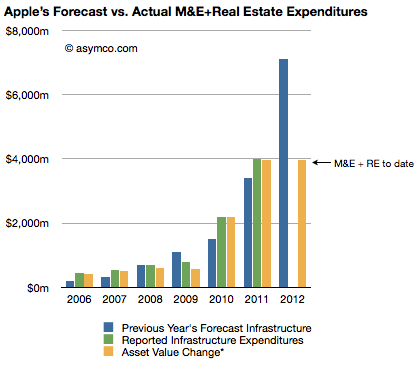
The Company anticipates utilizing approximately $8.0 billion for capital expenditures during 2012, including approximately $900 million for retail store facilities and approximately $7.1 billion for product tooling and manufacturing process equipment, and corporate facilities and infrastructure, including information systems hardware, software and enhancements.

The history of these expenditures is shown below (the blue bars are statements from 10K reports including the one above shown as the right-most bar): Three 10Q reports so far this fiscal year have given us updates on asset values and the change in these values are shown as the right-most yellow bar. The asset value change suggests $3.9 billion has been spent so far of the $7.1 billion budgeted. Thus we can estimate that about $3.2 billion remains to be spent in the fourth fiscal quarter (thus bringing the yellow bar to parity with the blue bar in the chart above–a parity that was achieved or exceeded for five out of the last six years).

Assuming $200 million of the fourth fiscal quarter budget will be for land and buildings[1] results in an estimated $3 billion remaining for product tooling and manufacturing process equipment and data centers.

The history of spending for various cost centers is shown below.[2]

Continue reading “Estimating third and fourth quarter iOS shipments”

How many Lumia phones were sold in the US?

Nielsen and comScore survey US consumers through different methodologies, however they both try to paint a picture of the smartphone patterns of ownership and consumption.

I regularly report on comScore’s data as it’s published on a monthly basis. Nielsen offers updates on a quarterly basis but there is more detail.

The latest report (for Q2) shows smartphone shares by both platform and vendor. The following graph is a treemap built with the Nielsen data:


The same data is also plotted below as a pie chart: Continue reading “How many Lumia phones were sold in the US?”

Why the iPhone matters: 8 questions for Horace Dediu

John Cox of Network World:

We asked him eight questions about the five-year impact of Apple’s iPhone, and he replied from his iPad.

Q: Five years ago, people actually began to get their hands on the Apple iPhone. There were other smartphones; no prior phone products from Apple; there was no App Store, no apps “ecosystem.” So what accounted for its initial success with consumers?

Read my answer and the entire interview here:

Why the iPhone matters: 8 questions for Horace Dediu