The PC market overview for Q1

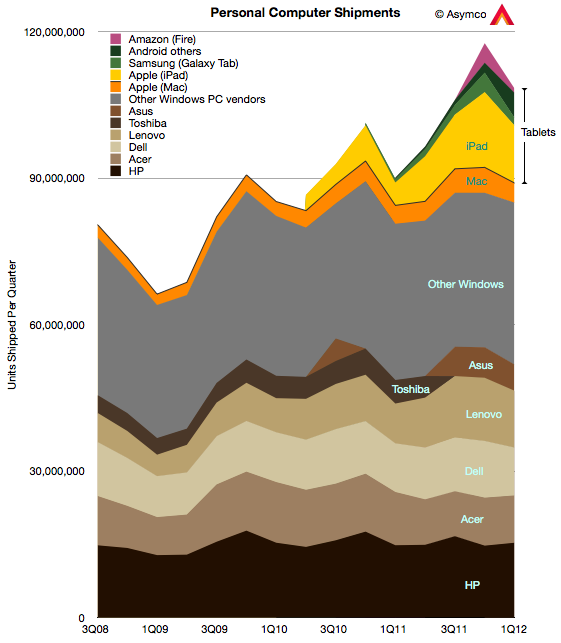
In terms of units Windows-based computers made up 78% of all PCs sold in Q1. That was an increase from the 74% in the previous quarter but a decline from 90% a year ago. OS X based computers were about 3.7%, a decline in share both q/q and y/y, something the company attributed to a transition quarter.

The following chart shows the composition of vendor volumes with tablet and traditional form factor computers included:

iOS computers (i.e iPad) were 11% of the market, declining from 13% last quarter but increasing from Q1 ’11’s 4.2% share. Apple reported that the iPad was not at supply/demand balance and thus could have sold more units. Continue reading “The PC market overview for Q1”

An interview with Chris Brennan for MacUser magazine UK

Chris Brennan asked a few important questions regarding potential saturation of the iPhone market.

Is the iPhone anywhere near saturation? Can Apple continue to shift iPhones in ever increasing numbers or is a sales plateau realistically on the horizon?

The market for mobile phones is approximately 5.5 billion connections, perhaps 5 billion users. The iPhone has approximately 300 million installed base. I consider a base of 1 billion users to be a minimum for continuing participation in this market long term. Licensed platforms will reach this in no more than two years. I don’t know what Apple’s ambitions are but if they don’t triple their base I don’t see a strong future for the company in mobile phones. In order to triple the base the company will need to sell substantially more than an additional 700 million iPhones. The retirement rate can be as high as 50% of installed base. Apple will need to sell at least 1 billion iPhones in the next few years. Seen another way, Apple has a market share of about 9% on a quarterly basis. This needs a lot of improvement. Chinese vendors are not standing still.

Can the Mac also continue to outperform the rest of the PC market for long? Continue reading “An interview with Chris Brennan for MacUser magazine UK”

An interview with Kenney Ho of The Chosun Daily of Korea

Kenney Ho, a staff reporter from Korean newspaper The Chosunilbo (The Chosun Daily) sent me a set of delightful questions.

According to Kenney, The Chosunilbo “has a history of 90 years, has been the most dominant, and influential paper of all time in Korea. It is the No.1 newspaper company in Korea with more than 1.8 million circulation, firmly holding the largest market possession. The paper is recognized Asianwide, where there are many readers in Japan and China.”

-You said “All mobile device vendors experiencing losses are not likely to really recover”. Even though, it wouldn’t mean that the employees, executives of Nokia has completely nothing in hands for recovery. If you are the CEO of Nokia right now, What are your steps to make Nokia recover its deficits?

My statement was based on the historic data which shows that 14 phone vendors have either exited the business or lost their independence during the last decade. No vendor that has reached a period of prolonged loss making has recovered. These are just observations and it’s possible that Nokia may be the first to recover. However, going by the patterns of the past, it would be very unlikely. When I thought about the reasons why companies have not been able to recover I came to the second observation about the way phones are sold. Once a brand reaches a point where it’s considered “risky” for distributors and operators to range they tend to defer purchases which leads to a spiral of continuing losses and more damage to the brand. The market amplifies “distress” and recovery becomes impossible.

If I were the CEO of Nokia I would set course for turning the company into a new business. I would approach the market asymmetrically and not try to compete directly with the other vendors. I would look toward services, platforms and software solutions and de-emphasize hardware.

-Many experts say that because Nokia dominated phone making industry in the 2000s, they maintained a corporate culture of complacency, which led them to decline. Do you agree with this? If you agree, Can you point out the examples of Nokia’s complacency? Continue reading “An interview with Kenney Ho of The Chosun Daily of Korea”

What retail is hired to do: Apple vs. IKEA

“Within five years after discount retailing pioneer Korvette’s opened its first store in 1957, over a dozen copycat discounters had emerged. In contrast, the giant discount furniture retailer IKEA has never been copied. The company has been slowly rolling its stores out across the world for [close to 50] years; and yet nobody has copied IKEA.

Why would this be? It’s not trade secrets or patents. Any competitor can walk through its stores, reverse engineer its products and copy its catalog. It can’t be that there is no money to be made: its owner Ingvar Kamprad is the third richest person in the world. And yet nobody has copied IKEA.

Our sense is that the other furniture retailers have followed the positioning paradigm and defined their business in terms of product and customer categories, which are readily copied. Levitz Furniture, for example, sells low-cost furniture to low income people. Ethan Allen sells colonial furniture to wealthy people.

IKEA, in contrast, has organized its business around a job to be done: “I need to furnish my apartment (or this room) today.”  When this realization occurs to people anywhere in the developed world, the word IKEA pops into their minds. IKEA is organized and integrated in a completely different way than any other furniture retailer in order to do this job as well as possible.”

Integrating Around the Job to Be Done (Clayton Christensen, Harvard Business School; Scott Anthony, Innosight LLC, Scott Cook, Intuit; Taddy Hall, Advertising Research Council).

IKEA is the world’s leading furnishing retailer and an amazing success story. As Christensen points out the success is all the more perplexing because it seems perfectly defensible. Nobody has tried to duplicate or undermine IKEA.

Positioned around a clear job-to-be-done it integrated design, manufacturing and distribution (including warehousing) as well as “big box” retailing as an experience.

This may sound familiar.

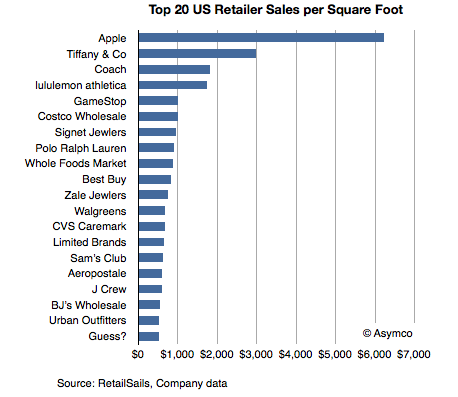
Apple’s entry into retail depended on a clear job-to-be-done, design, carefully selected merchandise and retailing as an experience. Similar to IKEA, Apple also became a dominant player in its segment and even achieved seventeen times better performance than the average US retailer in terms of sales per square foot.

At first glance they seem to be similar businesses in terms of strategy or “architecture” but how do the actual businesses stack up? Can we find data to support any claim of similarity. Continue reading “What retail is hired to do: Apple vs. IKEA”

Apple Stores have seventeen times better performance than the average retailer

Thanks to RetailSails we have some data on retailers in the US which can be used to calibrate the performance of Apple retail. RetailSails compiled a table of the top 20 chains by sales per square foot (annual basis). The total sample was 160 American retailers (excluding restaurants) that publicly report results.

Sales per unit area is a standard and usually the primary measurement of store success. Here are some benchmark figures:

  • Annual store sales in the range of $300 per square foot is considered respectable in the US.
  • The US national average for regional malls is $341.
  • The average for specialty apparel retailers is $400 per square foot.
  • The average for jewelers is in the range of $600 per square foot.
  • The median for the best 20 US retailers is $787/sq. ft.

The data for the top 20 is shown in the following chart:

The data shows Apple leading by a significant margin. It’s more than twice as efficient as the second place Tiffany and Co. It’s also more than seven times the median of the top 20 and seventeen times better than the average mall retail space.

Note also that this data includes only physical retail and excludes e-commerce, catalog or services revenues. It should only be used to compare physical retail performance.


The achievement is also remarkable when measuring growth in overall sales. Continue reading “Apple Stores have seventeen times better performance than the average retailer”

Half of US iPhones are repeat purchases

Canaccord Genuity analyst Mike Walkley writes in a note to clients today. “In fact, we believe iPhones are outselling all other smartphones combined at Sprint and AT&T and selling at roughly equal volume to all Android smartphones at Verizon.”

via iPhone Tops Sales Charts at Each of Its U.S. Carriers – John Paczkowski – Mobile – AllThingsD.

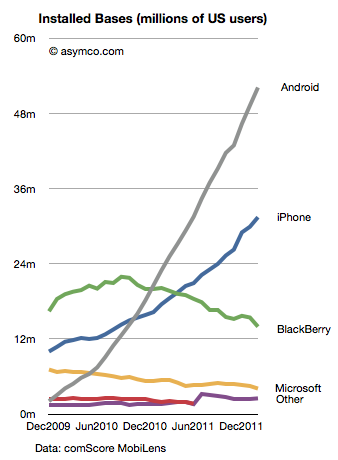
That’s useful data. Mainly because we can use it in combination with comScore data that tracks a different market measure. comScore’s MobiLens service tracks US mobile installed base. By measuring the difference between their stats one month to the next, one can measure the gain in a particular platform.

Comparing that gain with the sell-through rate in the same period can yield a figure for the number of units sold as upgrades vs. those sold to new users. Continue reading “Half of US iPhones are repeat purchases”

RIM to give up

RIM’s CEO, Thorsten Heins was quoted as saying, “We plan to refocus on the enterprise business and capitalize on our leading position in this segment. We believe that BlackBerry cannot succeed if we tried to be everybody’s darling and all things to all people. Therefore, we plan to build on our strength.”

via RIM to give up most consumer markets | Ubergizmo.

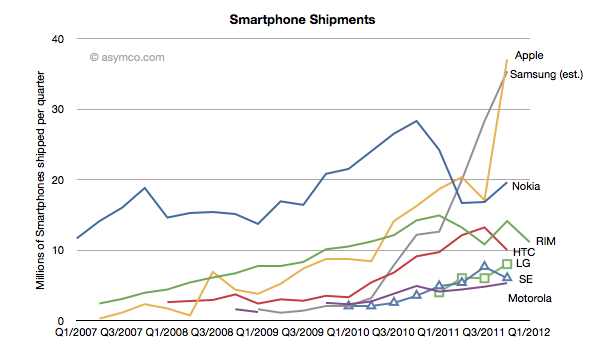
RIM’s latest quarterly results show a continuation of the decline in sales that began in Q1 2011.

Here are the highlights: Continue reading “RIM to give up”

Top-down vs. bottom-up: Which market analysis method is appropriate when disruption is knocking

In terms of platforms, IDC expects a relatively dramatic shift between 2011 and 2016, with the once-dominant Windows on x86 platform, consisting of PCs running the Windows operating system on any x86-compatible CPU, slipping from a leading 35.9% share in 2011 down to 25.1% in 2016. The number of Android-based devices running on ARM CPUs, on the other hand, will grow modestly from 29.4% share in 2011 to a market-leading 31.1% share in 2016. Meanwhile, iOS-based devices will grow from 14.6% share in 2011 to 17.3% in 2016.

Via: IDC – Press Release – prUS23398412

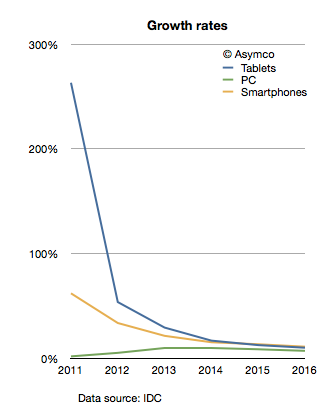
The company provides a stacked bar chart (follow link above) to illustrate their view of the market. I took the data they included and measured the implied growth rates for the product categories:

IDC is implying that in four years the tablet market will be growing at 10%, the Smartphone market will grow at 11% and the PC category will grow at 11%. Continue reading “Top-down vs. bottom-up: Which market analysis method is appropriate when disruption is knocking”

The parable of Nintendo

With the launch of the Wii console, Nintendo averted disaster. When the Wii launched in late 2006 Nintendo had been facing the simultaneous attack from the “seventh generation” Xbox 360 which launched a year earlier as well as the PlayStation 3, both of which set as their bases of competition 3D graphics at HD resolutions. Many wrote off the company and called the console market a two horse race.

Then, in what seemed a desperate downward leap, the Wii was launched into a different trajectory. It addressed non-consumers with a new, more intuitive controller and standard resolution rather than competing for hardcore gamers with more power and richer graphics.

Continue reading “The parable of Nintendo”

The unrelenting trends in the US smartphone market

The latest comScore US mobile subscriber monthly data is in: comScore Reports January 2012 U.S. Mobile Subscriber Market Share – comScore, Inc.

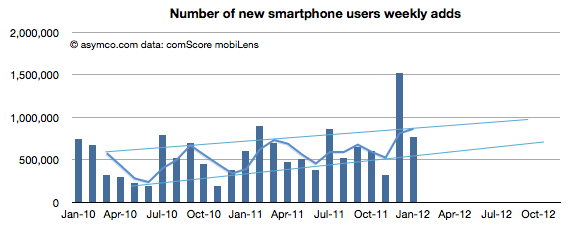
January saw a return to trend line growth in US smartphone add rates. The 767k/week rate is within the band after November’s below- and December’s above-the-line outliers. The weekly add rates are shown (with projection of trend) below:

The pattern shows a likely 1 million new smartphone users per week being added consistently by the fourth quarter of this year.

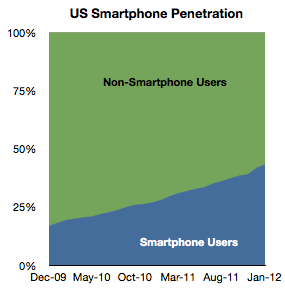
Overall, penetration of the sampled population (above age of 13, primary phone and excluding business purchases in the US) reached Continue reading “The unrelenting trends in the US smartphone market”