On being reasonable

The discussion on why Apple is cheap was very useful. The debate brought into focus the possible causes for pessimism in the face of overwhelming evidence to the contrary. But maybe there is yet another explanation. The way the data was presented was as a difference between historic and projected growth rates. Is this the way analysts actually think?

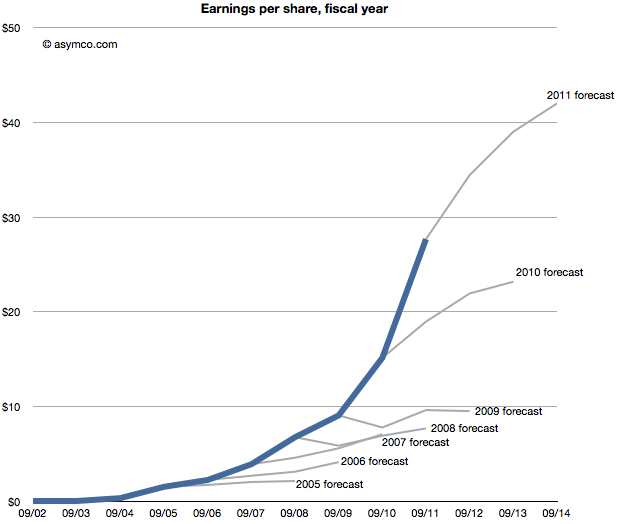
Perhaps they don’t project growth based on historic growth, but project earnings given historic earnings. In other words they don’t look at the first derivative (change in earnings) but the  shape of the actual data.

The following chart shows that data, i.e. forecasts as an extension of a sales trajectory. The blue area are actuals and the grey branches show projections at a given end of fiscal year.

Seen this way, we can imagine how the projections can be considered Continue reading “On being reasonable”

Why Apple is cheap

Imagine it’s late 2005. Apple’s fiscal year just ended and they reported their performance. You’re an analyst whose job includes forecasting the company’s performance for next year. This is a weighty responsibility.  Your forecast will be blended with those of your peers and used as a “consensus” average. That consensus for the next year will be used to measure the current value of the shares in a ratio called the forward PEG or Price/Earnings/annual earnings Growth. You are supplying the earnings and hence growth forecast while the market offers a price.  As a stock is meant to measure future earnings, your forecast is a crucial and frequently cited figure about whether a stock is priced fairly.

There is some comfort in knowing that there will be many others who will offer such a forecast and your contribution is thus not the only way investors can calibrate the price. However, you should think hard about what you are predicting as it also will reflect your skill in predicting such a visible company.

Apple just had a tremendous two years. 2004 and 2005 saw EPS grow at 274% and 337%. This is largely due to the runaway hit iPod. Given all that is known about the company, what will you put forward? While you’re at it can you also forecast two years forward, namely provide a growth forecast for 2006, 2007 and 2008?

Here is what you and your cohorts publish as a consensus:
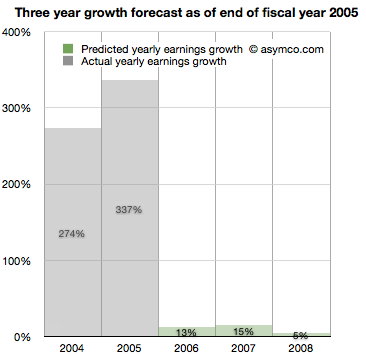
You go with a 13% growth for 2006,  15% for 2007 and 5% for 2008. The chances are, you reason, that the iPod will not carry the company’s growth much longer. The competition is sprouting all over and Microsoft is rumored to be launching its own music player.

It makes sense to be conservative and offer a modest growth of 13%. At the same time you can rate the stock a buy as it is still growing. The stock just doubled in the last 12 months and the law of large numbers says that growth cannot last at the same rate as we’ve just seen.
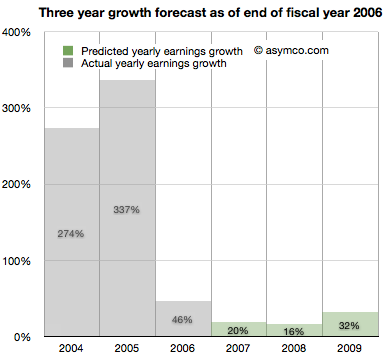


It’s now late 2006. Apple just closed out another big year. Contrary to your forecast last year, the company grew at a rate of 46%, more than three times faster than you expected.

It turns out the iPod still has some legs and the company’s Mac business seems to be growing. Looking forward you take your 15% growth for 2007 and increase it to 20% and suggest 16% for 2008 and 32% for 2009.

There are rumors of Apple getting into the phone business.

Continue reading “Why Apple is cheap”

Global smartphone penetration nearing 10%

Tomi Ahonen has compiled a fascinating data set on 42 major countries’ smartphone penetration rates. The compilation is based on Netsize Guide, Informa, Google and Ipsos data. It is a complex sample with multiple possible sources of error (read the post for the caveats.) However, this is a breakthrough. It’s the first time I’ve seen this level of detail at a country level in the public domain.

I maintain visualizations of ITU data which shows overall mobile consumption and broadband consumption and penetration. In order to maintain a consistent basis of comparison, I prefer to use ITU’s measure of consumption which is “subscriptions” rather than “population”. The ITU derives this measure because mobile operators think of points of connection (subs) rather than people as the measure of consumption. This makes some sense because connections are what are monetized–not people.

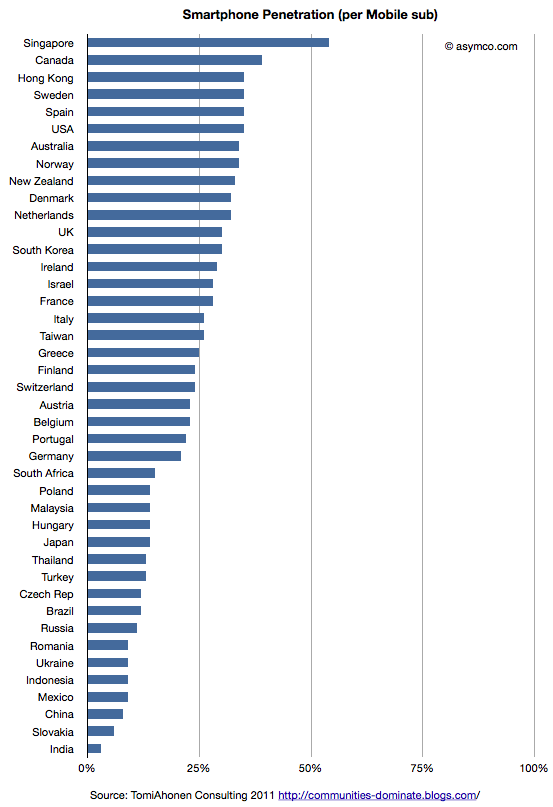
So the first piece of analysis is to show this measure of penetration (smartphones as a percent of subscriptions) for the 42 sampled countries.

This view shows which countries “lead” adoption in terms of penetration. It shows that the US is quite high in the ranking and the most penetrated “large” country.

This is highlighted by the following chart which shows penetration of smartphones vs. total subscriptions with bubble size representing population size. Continue reading “Global smartphone penetration nearing 10%”

Hiding in plain sight

Guessing the next Apple product has become the parlor game of choice for a whole generation of technology journalists and analysts. The premise of the game is that given a track record of breakthrough products, there is always another one just around the corner. Being the one to predict this next breakthrough product creates credibility and demonstrates the domain knowledge of the predictor. If the prediction fails to materialize there is consolation in dismissing the actual announced product as disappointing, unsophisticated or, worst of all, uninteresting.

Most often, these guesses are as much a reflection of the analyst as they are an analysis of the company. Too many predictions are designed to impress or demonstrate the imagination or knowledge of the predictor. They typically anticipate a giant leap of functionality, power or market re-structuring. They envision revolution not evolution; a cutting of the Gordian knot not a polishing of ugly rocks.

Yet nearly all of Apple’s launches have been sustaining improvements in existing products, technologies or platforms. To name just a few: Continue reading “Hiding in plain sight”

How productive is an Apple store employee?

Apple publishes data about its “retail segment” which ifoAppleStore.com catalogs. Here are some statistics I was able to compute from the data:

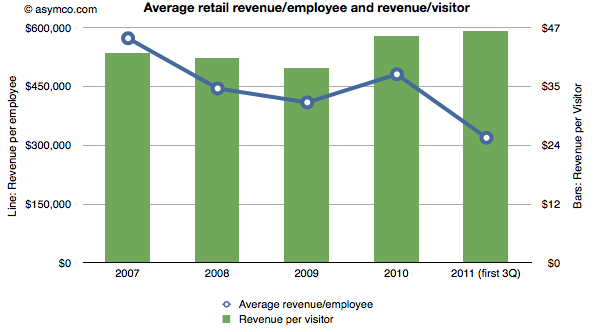
  • The stores generate over $100k per employee per quarter. In 2010, revenue was $481,000 per employee. This year the average is around $320k excluding the fourth quarter. In 2009 the average revenue for the technology sector was $388k/yr. A retailer like JC Penney generates about $124k of revenue per year per employee.
  • The revenue per visit is around $45. There are well over 250 million visits per year (222 million for first three quarters of 2011).

The combination of these two metrics are shown in the following chart:

Will Windows Phone get to compete with non-consumption?

Before diving into the answer to the question in the title, there is some new data to digest.

The latest from comScore shows consistency with the previous months of smartphone growth in the US.

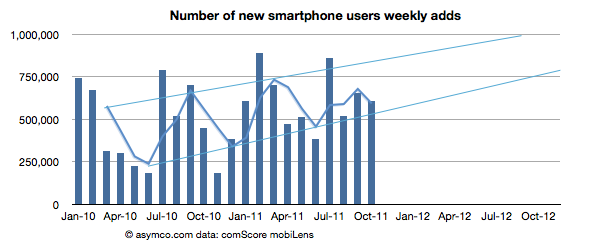
  • The growth rate was 607k/wk new-to-smartphone users. This is slightly down from 654k/wk for the previous month but up significantly from 450k/wk the year before.
  • The penetration of smartphones reached 38.5% (non-smartphones are at 62%)
  • The penetration should reach 50% before September 2012 with about 1.2% being converted every month.

The following chart shows the weekly add rate with a three-period moving average:

This chart is important in that it should first show signs of inflection in growth. Continue reading “Will Windows Phone get to compete with non-consumption?”

The big bang theory of computing

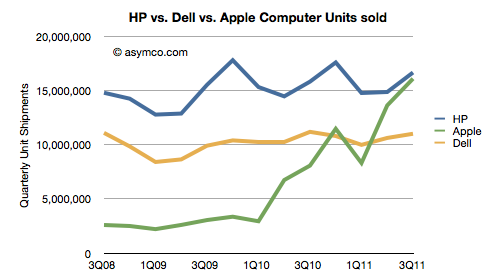
HP’s CEO Meg Whitman admitted that, when iPads are included, Apple will overtake HP as the world’s leader in computer shipments.

“We need to improve our game and our products to take over the leadership position. Apple could go past HP in 2012. We will try to become the champion in 2013.

When the quarterly shipment data is seen as a chart the doubt of this happening disappears:


Note that the combined iPad+Mac has already overtaken Dell. In fact, Continue reading “The big bang theory of computing”

How many iOS devices will be sold in 2012?

There are several methods I turn to when estimating device sales.

Top-Down Demand analysis

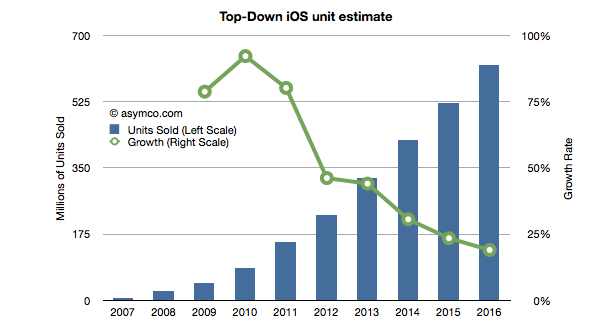
The first is to look at so-called top-down views of the demand. This method takes a view of the overall phone market and assumes share for smart devices and, further, shares for individual platforms. There are several estimates out there. The most recent is Ericsson’s Traffic and Market Data Report, released November 7 2011.

It concludes that in five years’ time mobile subscriptions will reach 8.4 billion of which smart devices (incl. tablets) will total 6.2 billion. As iOS has approximately a 250 million install base at end of 2011 and as the total base from Ericsson’s estimate for 2011 is 1.44 billion then Apple’s share is approximately 17%. If we assume that Apple will be able to increase smart device share to 20% (3 percentage points in five years) then by 2016 Apple will need to have 1.24 billion iOS subscribers.

Assuming that half the installed base upgrades every year and Apple adds devices required to reach the install base necessary (1.24b or 20% share) leads to the following unit sales projection (I’ve added 2008 through 2010 actuals and 2011 estimates based on my own current Q4 projections).


This Approach yields an estimate of Continue reading “How many iOS devices will be sold in 2012?”