The other tablets

Analysts have to count things in order to measure value. It sounds easy but it can be tricky. As I pointed out with PCs vs. iPads, if you count an iPad as a PC you can get into a lot of trouble with your clients. But if you don’t you end up directing them away from confronting an existential threat. Only very rarely is a market report published in contradiction to widely held sustaining beliefs. More often than not analysts bow to the source of their paychecks and in so doing show their rear end to the truth.

This comes up again now with respect to how to count tablets. Consider that there is little difference in architecture, software or design between an iPhone and an iPad. They run the same OS, use the same microprocessors and have similar communication methods, inputs and sensors. However they are considered completely different products and counted as part of separate markets. The only physical attribute that differs is the screen size. So we have to conclude that the size of the screen is a huge determinant factor in deciding whether a product is a tablet but not a smartphone (or music player).

But what about tablets themselves? Their screen sizes vary widely. A 10″ screen is certainly a tablet device, but a 4″ screen certainly isn’t. Where is the boundary exactly? Continue reading “The other tablets”

The growth surprise in Apple retail

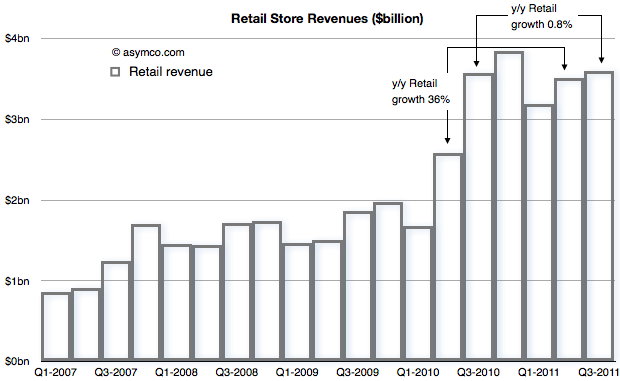
In Apple: For What It’s Worth Jeff Matthews asks a question “about the most disturbing pattern coming out of Apple’s earning release: the measly 1% year/year revenue increase at Apple’s retail stores”.

He notes that prior to the drop, Apple stores were growing at 36%. Such a huge drop quarter on quarter seems suspicious and he thinks something is happening.

Something is happening.

To find out what, let’s start with the revenue from Retail that Apple reports[1]


The concern is with that low growth between calendar Q3 last year and this year. That is being contrasted with the growth in the previous quarter (Q2) of 36%.

Continue reading “The growth surprise in Apple retail”

How much do Apple's factories cost?

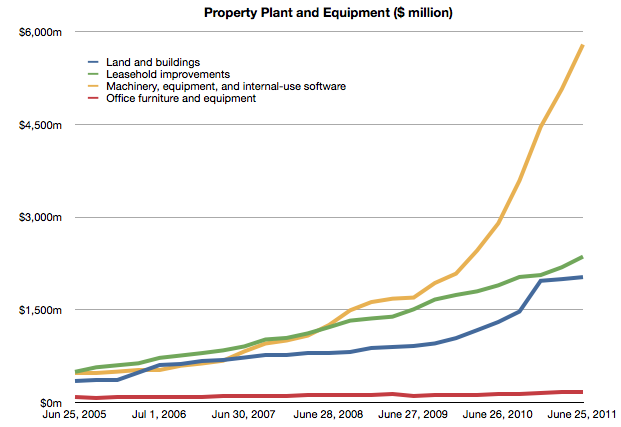
In the last two posts (How much does an Apple store cost?The down payment on iCloud) I discussed two line items in the PP&E asset class on Apple’s Balance Sheet. In isolation, the data is interesting as it gives us an idea of the cost structure of stores and facilities being developed to sustain its current business model. In aggregate, it provides insight into Apple’s strategic intent.

To complete the picture, I will look at the third asset: “Machinery, equipment and internal use software.” It’s the yellow line in the chart below:

It’s plain to see at first glance that it’s the most significant asset. What does it represent and what conclusions can we draw about Apple’s strategy? Continue reading “How much do Apple's factories cost?”

More media tablet hype

The iPad is still only slightly more than a year and a half old. Forecasting unit volumes has proven very difficult. But more than that it’s proven very difficult to appreciate the impact on the market it’s disrupting, PCs.

For some people this is obvious, but what if you don’t live and breathe disruptive theory? What if you don’t watch every data source like a hawk for hints of change? What if you are not even a technologist. How would you form an opinion on the effect of the iPad on PCs?

There are many industries and sectors about which I know nothing. If you asked me to analyze a market like industrial lubricants, I’d probably start by reading the consensus opinion put forward by the leading market analyst, an expert in that particular sector. That would form the baseline.

In the PC sector, that opinion is formed by Gartner (and IDC and Forrester perhaps). Gartner will get a lot of citations and its stats and opinion forms the baseline view. It may not be right, but we can expect it to be the “consensus”. This is because Gartner surveys a lot of data and interacts with a lot of insiders in the industry. They collect and weigh these inputs and put out what is likely to balance them all.

If Gartner says that the iPad is a “media tablet” that is not a PC they may be wrong. But they are also repeating what the PC industry is saying. So I value Gartner as a reflection of the consensus. If there is a significant gap between Gartner and what I conclude to be reality then there is an interesting opportunity as well as evidence of incumbent ignorance.

Let’s then look back on how Gartner has been reporting the iPad’s rise and the PC’s decline.[1] Continue reading “More media tablet hype”

Windows Phone, a year on

Windows Phone is in limbo. The company acknowledged that it has performed below expectations. During the last quarter for which we have data (ending June) I have an estimate that Windows Phone sold only 1.4 million units (Gartner’s sell-through analysis suggests 1.7 million). That gives Microsoft a 1.3% share of units sold (Gartner 1.6%), a new low.

At the same time, comScore data shows Continue reading “Windows Phone, a year on”

How many iPhones will be upgraded next year?

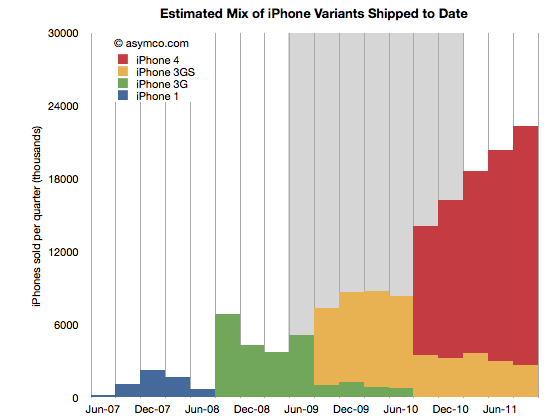
Last week I proposed that there were two significant markets for the new iPhone: 1) the existing iPhone user base 2) smartphone “non-consumers”. Today I want to dig a bit deeper into the first market to get an idea of what it amounts to.

The following chart shows the total iPhone shipments over time with an estimate for the mix of models during the last two years.

The way I calibrated the mix is by taking into account the statement that Tim Cook made Continue reading “How many iPhones will be upgraded next year?”

The new iPhone portfolio and implications on ASP

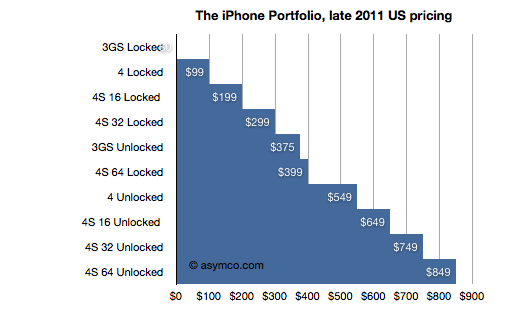
The iPhone portfolio is now larger than ever. It’s arguable that, for the first time, we can actually call it a portfolio vs. the [n, n-1] pair of products that’s been available to date. A year ago I even argued that the n-1 variant of iPhone was more of a cognitive illusion than a real alternative.

But that all changed last week. For the first time since launch, there is a real portfolio. The iPhone is now available as five different variants with 10 different price points. Prices and options may vary by country, but I took the US portfolio as the baseline and illustrated it:

Including all the pricing options It’s a very regular pattern. Continue reading “The new iPhone portfolio and implications on ASP”

Can the BlackBerry recover?

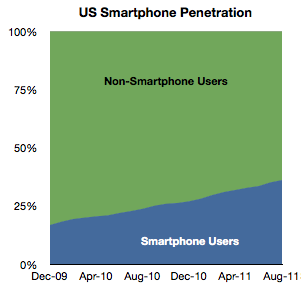
The August comScore mobile survey (MobiLens) is out. It measures the penetration or consumption of various mobile products and services in the US over a three month period.

I track the change in this data over time. Here are some highlights:

In August about 520,000 users switched to using smartphones (from non-smart phones) as their primary phone. This is a bit down sequentially from July but about average for the period starting January 2010.

Penetration increased by about 1 % to 36%.

Extrapolating this growth implies 50% penetration by September 2012. However growth is accelerating slightly so that tipping point may come sooner. Separately, T-Mobile reported that 75% of its device sales during this year have been smartphones, so if this is indicative of overall US market, then by next year it may in fact be quite difficult to find any non-smart phones to buy.

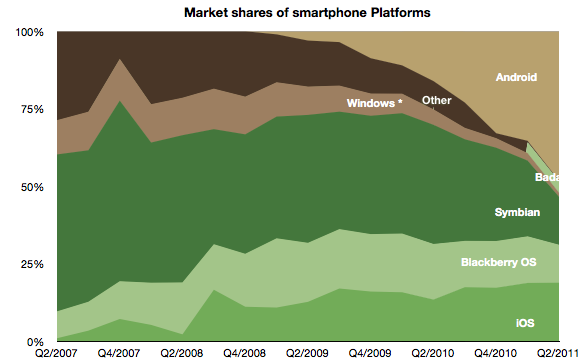
Among the smartphones, the different OSs have the following installed bases: Continue reading “Can the BlackBerry recover?”

At $2.9bn/yr apps are challenging songs as the most valuable online medium

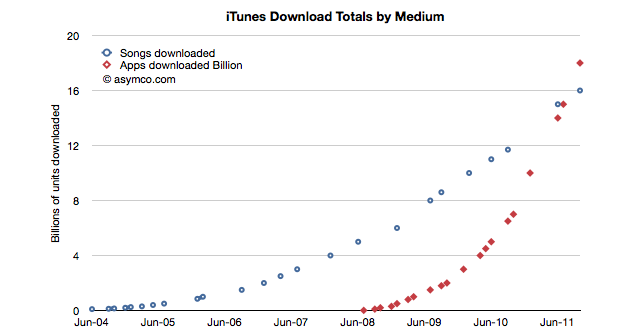
During the October iPhone event Apple gave an update on the app and song download totals. This is a reliable gauge of the iTunes ecosystem performance and Apple has been supplying these numbers for several years.  Plotting these numbers gives us a good idea of the trend in mobile content consumption. Here is the data to date:

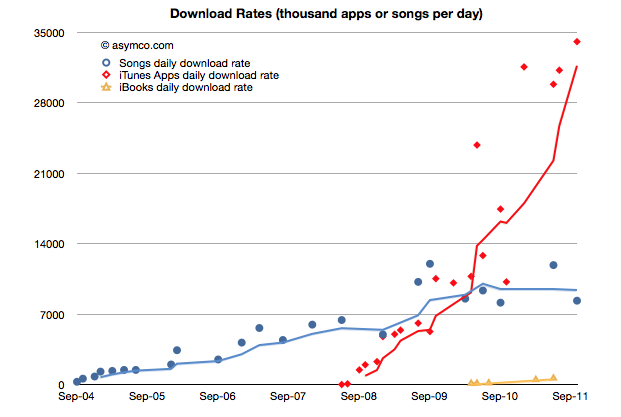
The total number of apps downloaded (excluding updates) overtook songs in June/July and continues on its trajectory. In fact, the rate of downloads for Apps is now over 1 billion / month. Given the data points above, I calculate it to be about 34 million per day. The corresponding rate for songs is 8.3 million per day.

You can see the rate of downloads as it’s changed over time here:

I used trailing four periods’ moving average for the lines to show the trend more clearly. The gap in download rates is large and increasing.

Now most observers would note that songs are much more expensive than apps, especially since there are no free songs and many apps are free. This would imply that the music business is probably more valuable than the app business.

That’s true, but not by much. To determine how much, I used the other data point offered: $3 billion in payments to developers. Since that represents 70% of gross revenues to Apple, we can determine that the average price per app is now 23.8c (down from 28.5c in April 2009)[1]. Knowing the app price we can plot both revenues and the margin that Apple keeps.

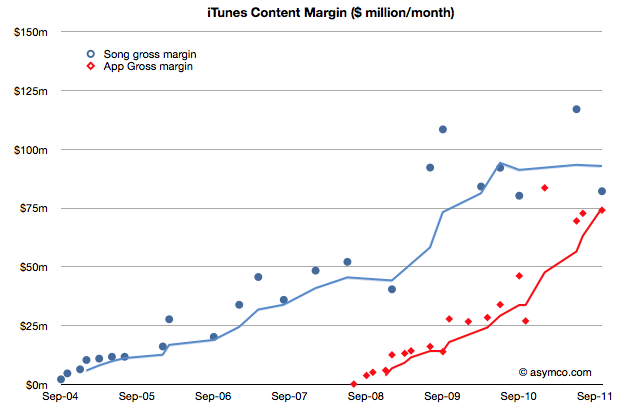
We can compare that with the margin that Apple keeps from songs (assuming a price point of $1.2 per song and a 73% pay-out to labels.)

The data jumps around quite a bit but the trend is pretty clear. After paying the content owners, iTunes is left with about $75 million per month from apps and $85 million per month from songs.

Apple then needs to pay other direct costs like credit card processing, bandwidth, storage, curation and testing. Then there are other operating expenses like R&D and marketing. These costs add up such that, according to Apple, they cover revenues, yielding a break-even operation.

Break-even or not, the way the data is trending it’s pretty clear that Apps will be responsible for a the majority of content cash flow at Apple.

At a billion downloads a month (and rising) the value in terms of revenues is already a run rate of $2.9 billion per year. This has been enough to overtake a business that has been running for more than seven years.

Notes:

  1. The payments to developers probably includes in-app purchases.