The trouble with halos

The Mac grew at 28% while the overall PC market contracted at 3%. The Mac has outperformed the PC market overall for 20 consecutive quarters.

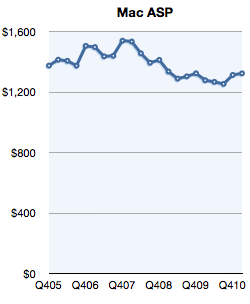
Prices increased sequentially and year-to-year.

I’ve mentioned the increasing shift of Mac mix to portables as a possible reason for the growth of the business. The Mac was one of the first to move to a portable form factor and has been pushing portability over performance for many years.

The following chart shows the relationship between growth and portable mix: Continue reading “The trouble with halos”

The Android step function

There is precious little data on Android units sold. There are estimates but no actual summary. Google themselves don’t seem to know as they don’t report sales, preferring to report “activations.”

Assuming that activations means “unique activations of new devices” then we can draw some equivalency between Google’s reports and the reported units of iOS sold. There is some uncertainty with respect to iPod touch units, but that is not very big (estimates are drawn from Apple’s reporting of overall iOS units at several points in time.)

To estimate Android, I took the download rates currently available and placed them in the month when they were published. I then interpolated the data monthly and quarterly.

To make the comparison more valuable, I chose to index the starting point at the launch of each respective platform and plot quarterly units (or activations). This way we can observe how the platforms ramped in growth and where they were at similar points in their lifetimes.

The following graph results. Continue reading “The Android step function”

First quarter PC forecast: Windows down 2%, Mac+iPad up 250%

Charles Arthur of The Guardian writes that PC sales “may have passed their peak“.  That’s a powerful, concise statement. It’s backed up by a quote from Gartner’s Mikako Kitagawa:

“This was the third consecutive quarter of mobile PC shipment declines in the US”

IDC even lays part of the blame to something called “media tablets”[1]:

“While it’s tempting to blame [PC] decline completely on the growth of media tablets we believe other factors […] played equally significant roles.”

But there are several problems with both IDC and Gartner’s analysis of the market. It’s hard to make out causality from their data. There is separation by vendor but not by operating system and there is exclusion of devices hired to do the same jobs as PCs.

For this reason, I need to do my own analysis. I retrieved Gartner’s public statements on the overall market and layered actual Mac and iPad units sold. I also added my estimates for the Q1 2011 quarter just ended to complete the picture.

We can now get an understanding of how the industry behaves with and without various platforms. The chart at the left gives the various growth rates of the market with platforms isolated from each other. I apologize for the shape of the chart but the scale does not permit a concise visual.

Including the iPad, the total PC growth is shown by the blue line. It shows that the market peaked during the recovery but is now slowing considerably.

The green line shows the PC industry excluding both the Mac and the iPad. Although it might include Linux or computers sold without an OS, the label “Windows PC” is a fairly close approximation. It shows that the market excluding Apple entered contraction this quarter and is out of sync with overall economic recovery and growth.

The red line shows the behavior of the Mac franchise. It’s well ahead of the overall market with 2x to 3x the growth. This has been a pattern for over 18 quarters.  I had some thoughts on this in a November 2010 hypothesis.

But the most telling line is the orange line which includes both the Mac and the iPad. In an industry where growth is usually measured in single digits, the iPad business brings growth in three digits.

This near tripling of unit sales is symptomatic of fundamental change that cannot be ignored. Although some analysts contend that the iPad is not causal to the decline in other PC sales, teasing out platforms data seems to show a divergent view.

The bottom line is that Windows-only computer units are down 2.0% while OSX-based computer units are up 272% (this excludes both the iPhone and iPod touch).

Correlation is not causation but tests or surveys where substitution can be proven do exist. For example, a recent survey shows that 77% of users reported that their PC usage decreased after getting a tablet. It also showed that 28% considered their iPad as their primary computer.

So coupling the sales data with the usage data does point an accusatory finger for the decline on the iPad.

In addition, some vendors are being hit harder than others which also hints at where substitution is happening. For example, IDC reports that Acer US unit shipments fell 42% in the first quarter and 16% globally (Gartner’s numbers are less dramatic but in the same direction). Since Acer is known for its netbook computers it’s another telling sign of possible substitution (Acer’s own management has indicated as much.)

So the weight of evidence is beginning to be conclusive: the iPad is the new PC. It should be clear by now that the iPad moves computing into new contexts so it does not yet substitute the PC market but extends it and increases consumption. Substitution is happening in low-end grazing type of usage, a place where the PC was ill-fitting anyway. Incumbent vendors might actually be relieved that the lower margin netbook is finally being supplanted and they can concentrate on the higher end.

Notes:

  1. Analysts like to call the iPad a “media tablet” but the same AdMob survey shows media consumption to be one of its least popular uses.

HTC and self-determination

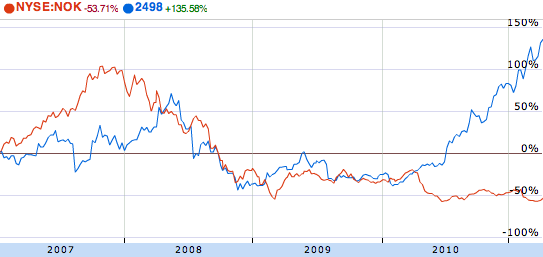
HTC’s market cap has just overtaken Nokia’s. While market capitalization is a fickle thing, shifting with sentiment, this is still a remarkable feat. Nokia’s market capitalization has almost halved in the space of a year while HTC has more than tripled from $10 billion to over $33 billion.

If you roll back to 2007 and the start of the modern era of smartphones, you can see how the two companies stocks traded places:

(source: Google finance)

Continue reading “HTC and self-determination”

Which mobile users will platforms harvest first?

When tallying up the race to a billion users, I noted that both iOS and Android seem to have the potential to reach that size of user base. However, that raises the question of where those users will come from. We have to note the fact that there aren’t a billion users to be captured today.

If not today, then how soon, and where are they?

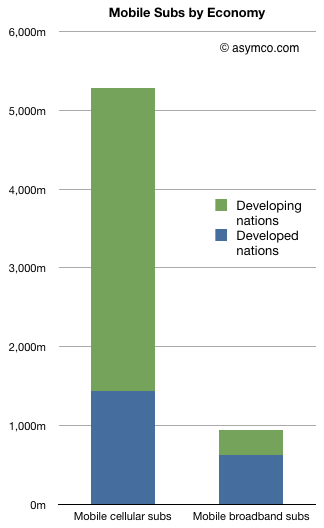
The first question is who is addressable. If we stick with mobile cellular subscribers, there seem to be plenty of users (at least 5.3 billion as of October 2010 according to the ITU). However, the number of “mobile broadband” (i.e. 3+G network subs) is about 940 million. The chart to the left shows the difference and adds the subdivision between developed and developing economies.

Over half (51.1%) of developed nations’ populations have signed up for mobile broadband while only 5.4% of developing country populations are on 3G. And whereas developing countries have added 2.6 billion mobile subs in 5 years, they added only 293 million mobile broadband (MB) subs. Developed nations added 574 million MBs in the same time frame.

As a result, two thirds of mobile broadband subscribers reside in developed nations as of 2010. This number will decrease rapidly as MB penetration reaches saturation in developed countries, however the race to a billion is being run in these markets first.

Continue reading “Which mobile users will platforms harvest first?”

The billion dollar Smart Cover

I was only half-joking when, on first sight, I tweeted that I will buy a new iPad 2 to go with my new Smart Cover. The new iPad cover is enchanting.

It also seems to be enchanting to many.

I’m estimating that at least 60% of iPad buyers will get one. Based on an estimate of 36 million iPads sold in 2011 and an average price of $48 (70% polyurethane and 30% leather mix), the total revenue for Smart Covers will top $1 billion this year.

I further estimate that with a very modest gross margin of 75% (average cost to produce of $12), the Smart Cover could contribute $777 million to Apple’s gross margins.

The iPad by itself should generate $23 billion in revenue and a contribution of $7.7 billion. That means that the Smart Cover will add 4% to sales and 9% to gross profits. If taken as a bundle, the iPad+SC will increase gross margin over the iPad alone by nearly 200 basis points (taking it from 33% to 35%).

It will be interesting to compare the Smart Cover business with competitor tablet businesses.

The Race to a Billion

I last looked at the race to a billion in September 2010. I’ve now added a few more data points to the tracked platforms and also added points for the major console game platforms and Symbian.

The chart shows the cumulative number of users (approximated by units sold) for 11 platforms indexed to the same starting date. The horizontal axis is the number of quarters since a platform launched. Every fourth quarter is numbered so each number on the axis represents a new year. The last number on the axis represents 10 years.

The vertical axis is the cumulative number of users on a logarithmic scale. Each number of the vertical axis is 10x more users than the previous number. The top of the graph represents a billion users.

The overall chart shows how quickly a platform has grown and is bounded by a billion users and a decade of usage. Continue reading “The Race to a Billion”

iOS distribution: do operators hold the keys?

As iPad shipment volumes increase and as the iPod touch becomes the de-facto iPod, it’s time to look at the overall split between iOS devices.

I will focus the discussion between iPhone and iOS “others” because I believe the two categories differ greatly in terms of their positioning and market strategy due to the different channels.

The company does not provide iPod touch units shipment data but it can be estimated that, based on overall iOS numbers released in September, iPod touch represents approximately 50% of iPod units sold.

If we put all we know together about volumes, we have the following chart: Continue reading “iOS distribution: do operators hold the keys?”

Flummoxed, again

The last time I took a snapshot of the iPad death watch it was March 9th, 2010. Almost a year ago. The now-classic quotes are reproduced here.  Last May I wrote:

Apple keeps a tight lid on new products so that competitors don’t get a head-start on copying, but in the case of the iPad, advance knowledge would not have had any impact. Competitors look at the iPad and see nothing.  They’ll only react once the market explodes and they start to feel belated pain.

I thought that would be that. As the success of the product would become self-evident, predictions of imminent demise would trail off. The pain of share loss would prompt a wave of challenger copycats. Imitation would be the the best form of flattery.

But no.

Critics were not silenced. One year, 15 million units, and $9.2 billion later I went back to the source of the quotes and found the following (published quotes dated after March 9th 2010). (Cited from aaplinvestors.net with some editing for brevity and relevance):

Continue reading “Flummoxed, again”

Apps are 15 times more popular than ebooks

“It doesn’t matter how good or bad the product is, the fact is that people don’t read anymore,” he said. “Forty percent of the people in the U.S. read one book or less last year. The whole conception is flawed at the top because people don’t read anymore.”

The Passion of Steve Jobs – NYTimes.com

It was almost exactly three years ago that Steve Jobs dismissed the Kindle reader as a futile attempt to change user behavior.

Yesterday, Steve Jobs announced that the iBooks store served 100 million ebooks in its first 11 months of operations.

So do we have another example of Steve’s classic misdirection where he dismisses a category only to enter and dominate it at some later time?

Let’s look at the data. The chart below shows the sales ramp of three media types served by Apple: songs, apps and books. Continue reading “Apps are 15 times more popular than ebooks”