Unforeseeable growth: Analyst failure on iPad as indicator of disruptive change

Professional analysts’ first year iPad unit forecasts (sourced from TMO Finance Board)

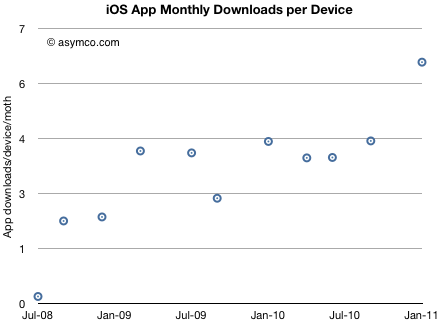
iOS users download about 5 apps every month

Thanks to a reader for asking this question: “Wouldn’t it be more telling to look at the monthly rate of downloads / device at any given time?”

Yes it would.

Here’s what can be derived based on download rates and installed base of devices.

Continue reading “iOS users download about 5 apps every month”

How long before apps overtake physical video game content sales?

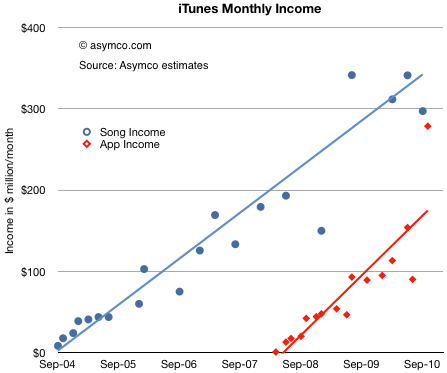
After reviewing the payments to suppliers, we can look at the store’s revenue generation rate. With the same assumptions, we have the following chart:

We will have to wait for another report to see whether the recent burst of volume from apps is sustained[1], but the trend shows income from apps narrowing the gap to music. Continue reading “How long before apps overtake physical video game content sales?”

iTunes has paid over $2 billion to app developers and $12 billion to record labels

The last analysis of the iTunes content store showed amazing acceleration in download rates. Since we know something about the pricing of apps in aggregate, we can make some guesses about the income from apps for both Apple and suppliers.

The key assumptions are:

  1. Average selling price per app $0.29 (as reported in June 2010 here).
  2. Price per song $.99 increasing to $1.05 over time
  3. Music gross margin 10%
  4. App gross margin 30%

The first chart shows the accumulated payments made to suppliers of content to the iTunes store over time. Continue reading “iTunes has paid over $2 billion to app developers and $12 billion to record labels”

More than 60 apps have been downloaded for every iOS device sold

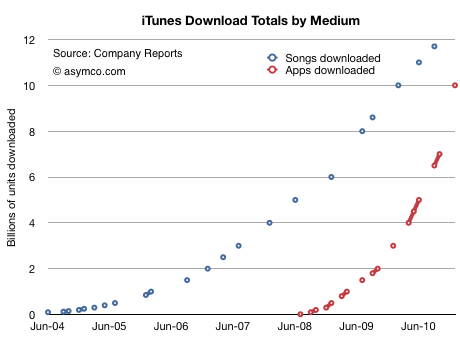
The iTunes App Store is about to reach 10 billion downloads. That makes this a good time to revisit app growth metrics and compare them with the other digital media store that we have data for: the iTunes Music Store.

First, the download totals as time series[1]:

Continue reading “More than 60 apps have been downloaded for every iOS device sold”

Is Android more efficient than iOS at generating search revenue?

Thanks to David Chu for forwarding the data that made this possible and reader Narajanan for spotting the divergence in platform efficiency.

iOS and Android are both growing rapidly. According to Gartner, during the first three quarters of 2010, about 44 million iOS devices and 36 million Android devices were put into use. That’s 80 million devices. An amazing achievement for two platforms that did not exist 3 years earlier.

But obviously not all devices are used the same way. Devices which have unused capabilities limit network effects for a platform and for the category of product in general. Question is: how can we measure the “smartness” of a device; how much more likely is a device to be used as a mobile computer vs. being a regular phone?

The best proxy I can think of is a measurement of browsing use. Continue reading “Is Android more efficient than iOS at generating search revenue?”

Big in Denmark: iPhone captures 36% of phone market value

Thanks for Rob Marsh for forwarding the following snapshot of data from Denmark:

Salget af smartphones eksploderer i Danmark.

According to GfK data in Denmark, during the first quarter of 2010 29% of phones sold were smartphones. In the second quarter, the share grew to 37%. In the third quarter, 51% of units and 71% of sales value was captured by smartphones.

Looking at September alone, Apple’s share of the smartphone market was 34%. In terms of value share, 51% of all the dollars that consumers spent for smartphones, was spent on the iPhone.

In other words, Continue reading “Big in Denmark: iPhone captures 36% of phone market value”

For every AT&T Android user there are 15 iPhone users: What will be the ratio at Verizon?

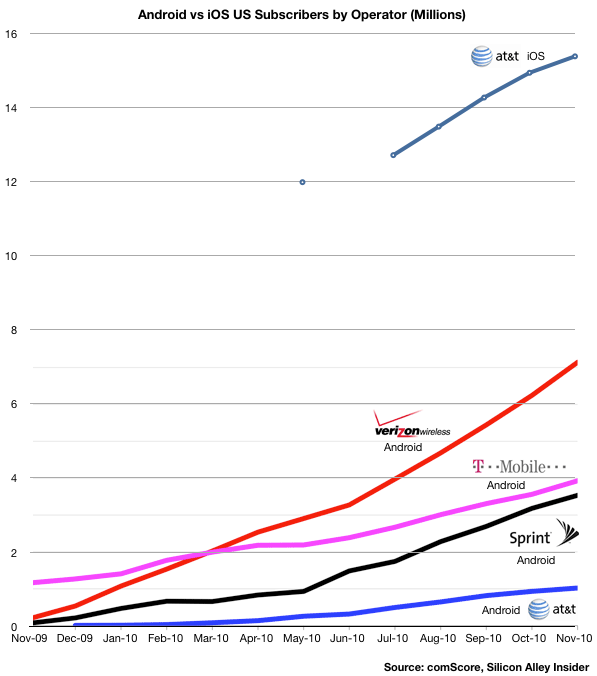
The following chart uses comScore data to show the relative consumption of Android vs. iOS by the subscribers of the four major US operators. I modified an original chart published by Silicon Alley Insider.

A few observations: Continue reading “For every AT&T Android user there are 15 iPhone users: What will be the ratio at Verizon?”

Nearly 75% of iPhones are in use outside the US

comScore reported that 15.4 million iPhones were in use in the US as of November. (25% share of 61.5 million total smartphones.)

We also know that about 75 million iPhones were sold by November since the product launched. With about 17 million units older than two years, and assuming that half of those might still be in use and that all the iPhones less than 2 years old are still in use, we get an upper bound of 66.5 million iPhones in use globally.

That means 23% of all iPhones are in use in the US and that 77% are in use outside the US.

Can this be verified? Continue reading “Nearly 75% of iPhones are in use outside the US”

Half of US population to use smartphones by end of 2011: Update

Half of US population to use smartphones by end of 2011 | asymco.

A month ago ComScore reported that in October 2010 25% of Americans above the age of 13 used smartphones. The latest report shows that share to have risen to 26.3%.

That means there are 24 percentage points of penetration to go until the majority of Americans are smartphone users. In absolute numbers this implies about 56 million additional users (and hence units sold).

The rate of penetration growth was 1.3 percentage points per month. Assuming no acceleration in this figure and assuming we rely on ComScore (vs. Nielsen which reports higher figures) then majority share is 18 months away, or mid-2012.

However, assuming some acceleration and a different sampling method, I still believe that we could see this figure by end of this year.

In either case the tipping point is near.