Apple devices take 41% of mobile traffic in Finland

In first half of 2010, iPhone and iPod touch traffic increased from 33.9% to 41% in Finland. Apple’s devices account for a very small percent of the total phones in use in Nokia’s home country.[1] The analysis was performed by QAim on a sample of 64 million “mobile downloads”.

Google Translate.

Original article in Finnish.

“A wave of iPhone and iPod owners behave differently than others.”

Weird bunch, those iPhone owners…

[1] Installed base of iPhone is small but share of smartphones in recent quarters is above 20%.  See: YLE: Nokia’s smartphone share crumbles in Finland

Bond market discounting Nokia's credit rating

The world’s largest mobile-phone maker’s bonds are trading as if Nokia’s rating has been cut, with spreads over government debt widening as the company strives to develop devices with the same mass appeal as the iPhone, Research In Motion Ltd.’s BlackBerry and devices based on Google Inc.’s Android software.

There’s a “significant amount of risk overall with Nokia’s business model,” said Scott Shiffman, who directs bond research at Chapdelaine Credit Partners in New York. “Credit spreads should move wider over time and ratings will continue to move lower. We think the ratings agencies will play catch-up to the business deterioration.”

via Nokia’s Credit Rating in Jeopardy on Falling Profit, Bonds Show – Bloomberg.

Management response continues to be that Nokia is “by a very wide margin the largest supplier of smartphones and small computers in the world.”

300k apps have been approved for the iTunes app store

Following up on the 300k app prediction:

  • Total Apps Approved: 301316
  • Total Available Apps: 252076
  • Total Available iPhone Apps: 239210
  • Total Available iPad Apps: 23742

via iPad Apps, iPhone Apps, Deals and Discovery at App Shopper – Popular Recent Changes.

Note the near 24k apps for iPad.

HTC: How They Compare

In the last mobile market update series I wrote of  the evolution of market share, the shift in where dollars are spent, the tale of ASP erosionprofitability ratios over time and EBIT share over time.

I did not include all vendors for various good reasons. The first survey (market share) did include an “others” category that made the volume data complete, but in the financial data sets, I chose to include the top 7 vendors that make up 80% of device volumes.

One noteworthy vendor that was not included was HTC. HTC is an important vendor for several reasons:

  • it’s a pioneer in smartphones having made the first Windows Mobile devices and the first Android devices
  • at one point it sold 80% of all Windows Mobile devices
  • even if it did not brand its devices, it was the name behind many re-branded or white-label operator branded phones
  • it has a brand of its own today and is expanding its reach

HTC has been around building devices since 2001 and so it would be a pity to exclude them from any analysis of the effect of iPhone on the market or any discussion on the effect of smartphone disruption on feature phones.

The challenge with HTC was that historically their branded devices and white label devices were not reported by the company separately. This matters because white label devices are valued differently. Typically these devices are not marketed by the original manufacturer so SG&A is not applied to their cost base. Operating margins, ASPs and hence profitability is not directly comparable with other OEMs.

But HTC has recently changed its reporting. Thanks to a reader I discovered that, since 2008, HTC has been listing its ASP and Operating Margin making direct comparisons possible. I still don’t have all the data, but enough to add HTC to the analysis.

So, here are the 5 industry performance criteria, now with eight vendors listed.

Continue reading “HTC: How They Compare”

Analyst production forecasts for iPhone and iPad

On the iPhone, the firm raised their production forecasts from 14 million units to 18+ million, aided by easing constraints of display panels. Checks show consistent shortage of iPhone 4 inventory at Apple stores and there continues to be a three-week shipping delay from Apple’s online store, the firm notes. As a result the firm has increased confidence in its 4QFY10 iPhone unit estimate of 11.6 million, which is up 39% sequentially.

On the iPad, the firm’s build forecasts were revised up from 6 million to 7 million, which compares to their iPad shipments estimate of 4.75 million. The firm believes [there] is upside to the Q4 estimates and CY10 estimates of 13.4 million units, given the strong demand and anticipated production ramp heading into the back-to school and holiday seasons, as well as the high level of interest from business customers as expressed by AT&T.

via StreetInsider.com – All Apple (AAPL) Products Lines are Humming Along – Analyst.

These sound reasonable and credible. Note that production forecasts don’t translate into sales forecasts as there is inventory, and some of that inventory will be held by Apple and some by the manufacturer.

My Q4 estimate sits at 12.1 million iPhones and 4 million iPads.

Visualizing the winners and losers of three years of smartphone share growth

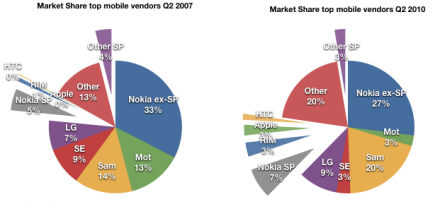
Many consider June 2007 to have been a pivotal moment in the history of mobile phones. Apple’s entry with the iPhone has re-defined the market in many ways. However, there was a smartphone market before then. About 28 million smartphones shipped the quarter when Apple launched out of an overall phone market of 265 million. Apple’s entry with 270k phones was a drop in the bucket.

I thought it would be instructive to chart what happened between that quarter, exactly three years ago and today. I collected the data from IDC, Gartner and Canalys and company reports to paint a few pictures.

First, the market shares (by units) of the top mobile vendors, Q207 vs. Q210. I highlighted the smartphone vendors by separating their wedges from the pie. Note that I also separated Nokia’s smartphones from Nokia’s regular phones as two separated wedges–Nokia ex-SP for no smartphones and Nokia SP as their “converged” units. I did the same with “other”.

Continue reading “Visualizing the winners and losers of three years of smartphone share growth”

Warner Music slows while iTunes grows

Revenue from digital sales of recorded music grew just 3.7 percent to $169 million. That’s a slower pace than the 4.5 percent growth posted a year ago and 39 percent growth two years earlier.

via Warner Music CEO looks `beyond iTunes’ amid losses – Yahoo! Finance.

For the record, iTunes did grow at 35% in the quarter that Warner Music grew digital sales by 39% two years ago.

But the two diverged a year ago with 17% iTunes vs. WMG’s 4.5% and this past quarter iTunes grew at 27% vs. 3.7%.

Gives us an idea of how much Apps have swelled iTunes’ top line.

T-Mobile US celebrates nearly 20 percent smartphone users

T-Mobile loses 93,000 customers but triples smartphone base | Electronista.

Thanks to Android, T-Mobile tripled its smartphone user base in one year. Evidence again of a secular shift to smartphones and the value of Android as gap-filler for Apple’s inability/unwillingness to satisfy demand.

RIM's decomposing innovation

It’s hard to get excited about the new RIM Blackberry Torch.  It’s not exciting in a positive way and not exciting in a negative way. It’s just more of the same and the same is not all that bad. Then again, the same is not all that good either. Every piece of the Torch product is playing catch-up with others’ innovations without enhancing the core innovation RIM itself brought into the market years ago.

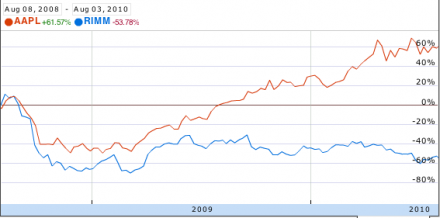
RIM has a significant but deteriorating share and is a company that has done very well as an entrant in a space dominated by larger incumbents.  But there is a strong smell of Palm about it.  The musty smell of decomposing innovation. Wall Street seems to smell it too (two year stock price chart relative to AAPL below)

The problem seems to be that, like in Palm’s case, mobile computing is a game for big companies.  If you ask why Palm and RIM became uncompetitive you get two different reasons. Palm could not do hardware and distribution well and RIM can’t do software well. But these reasons have remedies which neither company can bring to bear: resources and processes. Palm did not have the resources for distribution and production and RIM did not have the processes to be a software platform company.

Their values and priorities are adequate but competitiveness today, in this market, requires projecting market and development power.

I can only conclude that RIM is simply too weak to make it in the long run.

Canalys: Android global share rises to 16% of smartphones in Q1 [Updated]

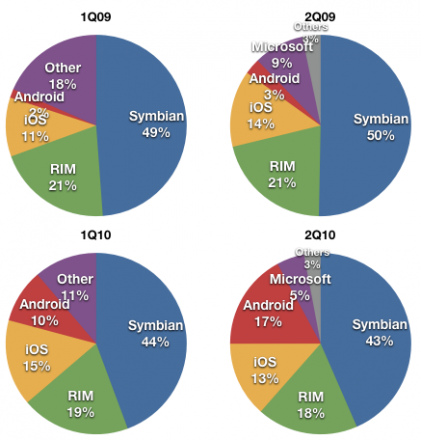
According to Canalys:

Usual disclaimers apply:

  • Only sell-through (i.e. not exact numbers that companies report as sold, i.e. excluding inventory in the channel)
  • Other includes Symbian devices not sold by Nokia, Microsoft Windows Mobile and various Linux, WebOS
  • iOS includes only phones, no iPads, no iPod touch, similarly Android includes only phones
  • Some of these numbers are approximate as they are based on partial data (Canalys does not publish complete share data and some must be interpolated)

Data used to build charts: Continue reading “Canalys: Android global share rises to 16% of smartphones in Q1 [Updated]”