Schiller’s Law

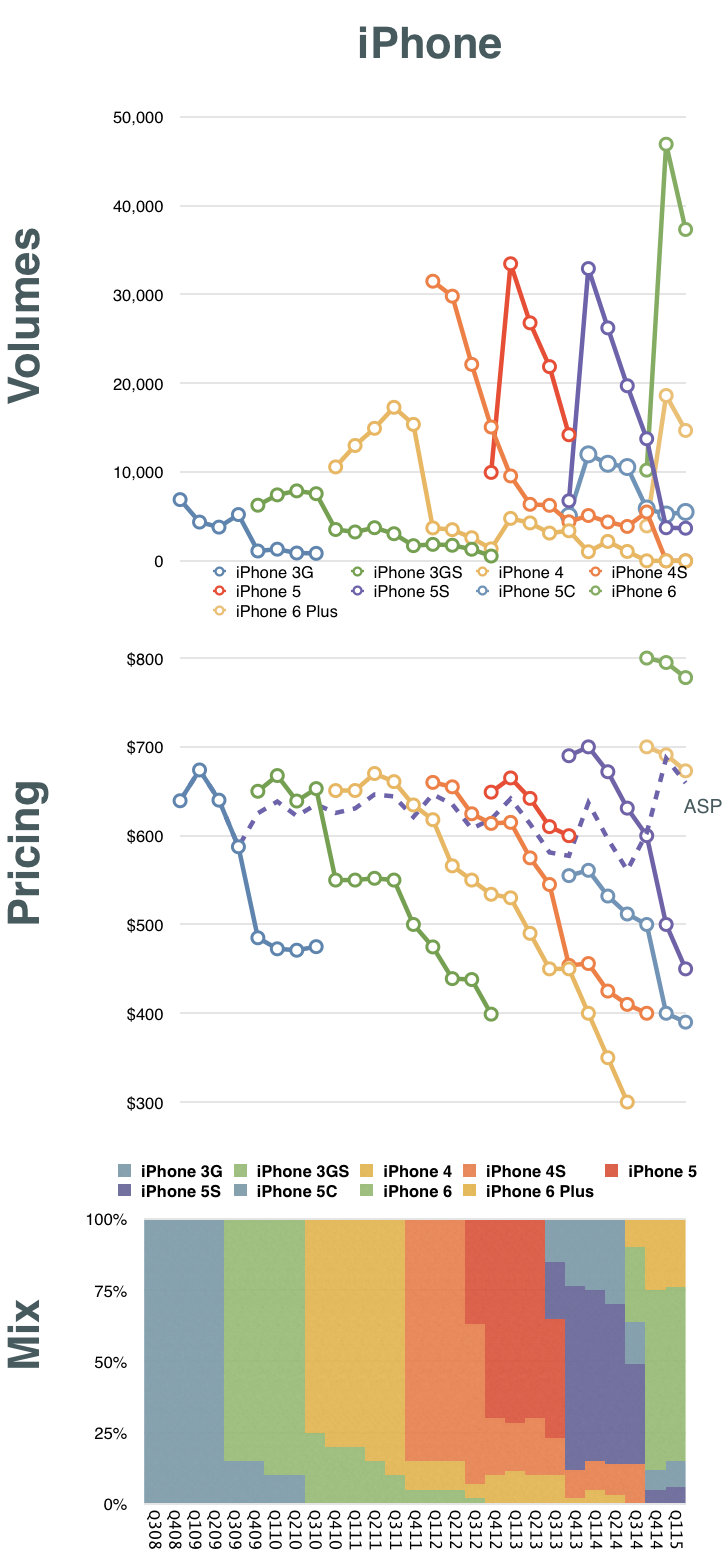
We know how many iPhones Apple ships but we don’t know exactly how many of each model. We can try to come close in such estimates of “mix” by looking also at the market pricing of the phones and the average price Apple obtains1

Combining what we know with some guesses allows some of us to estimate the composition of iPhone models in any given quarter’s sales. Here is a graph showing my estimates:


Screen Shot 2015-05-22 at 2.53.36 PM

Having this, we can then assess how each generation of iPhones has performed. Remember that although we had a new iPhone for each of the last eight years, there are only 5 generations in total. Starting with the 3G (second generation) the generations were two yearly product cycles long.

The resulting estimates for generational growth are shown below.  Continue reading “Schiller’s Law”

  1. ASP = Revenue/Units shipped. However, note that there are deferrals in revenue as part of this. []

How many iOS devices will Apple Ship in the next six months?

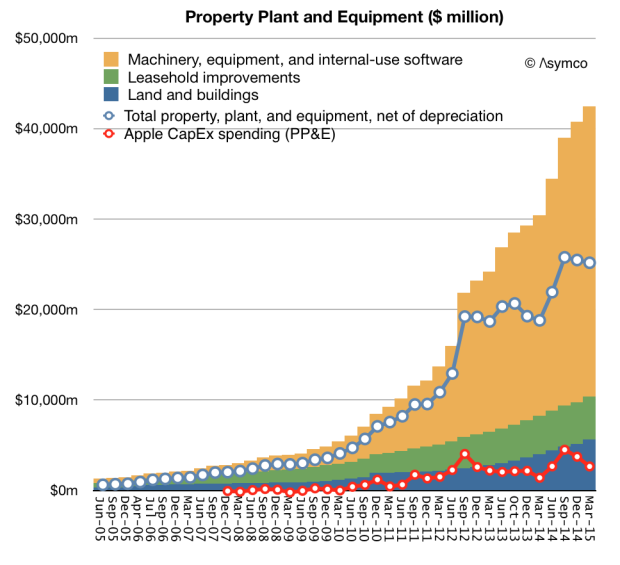
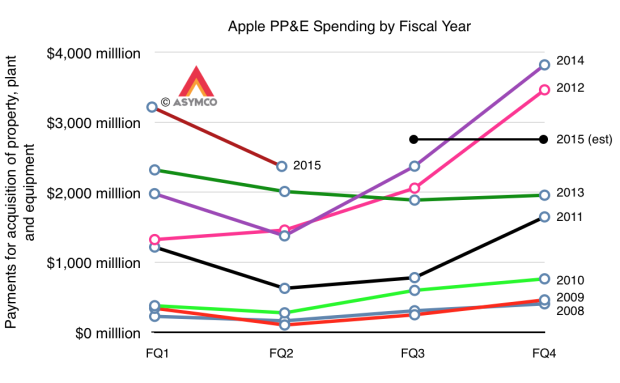
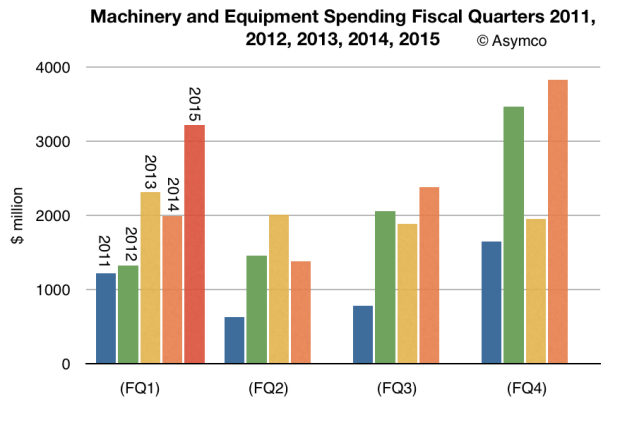
Of the $42.5 billion Apple spend buying capital assets1 more than half was acquired in the last three years. Net of depreciation these assets are currently worth $20.1 billion and the spending rate is about $12 billion per year.

This strategy of spending on capital assets is primarily in support of its particularly integrated approach to its product strategy. The purchasing of tooling for product manufacturing gives many benefits, including ability to deliver uniquely differentiated hardware, a predictable ramp and availability of parts throughout the product lifecycle.

Screen Shot 2015-05-05 at 3.02.04 PM

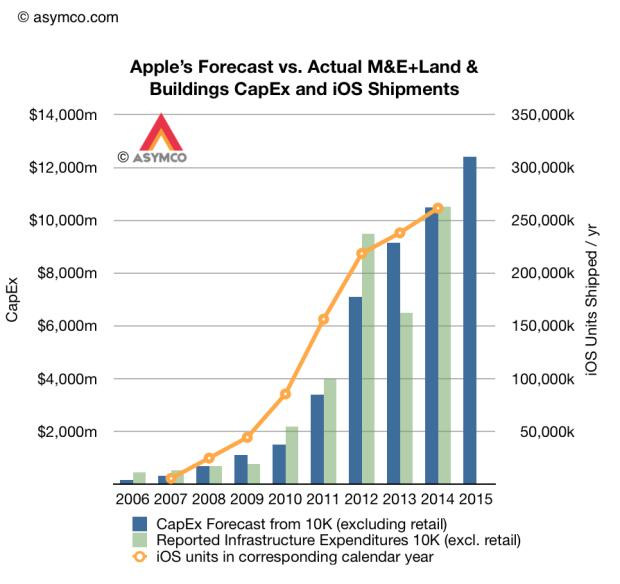
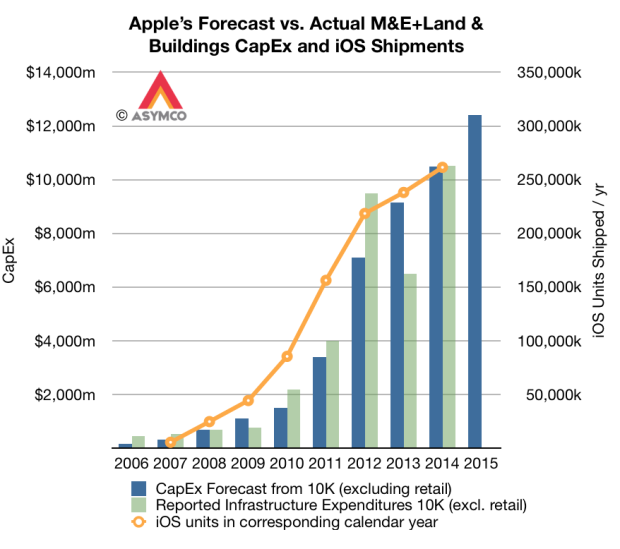
One additional benefit (for us) is that we get to inspect the allocation of resources prior to production and therefore we can more easily forecast the product’s supply. Spending on tooling happens in advance of production and the company also provides full year predictions of its spending.

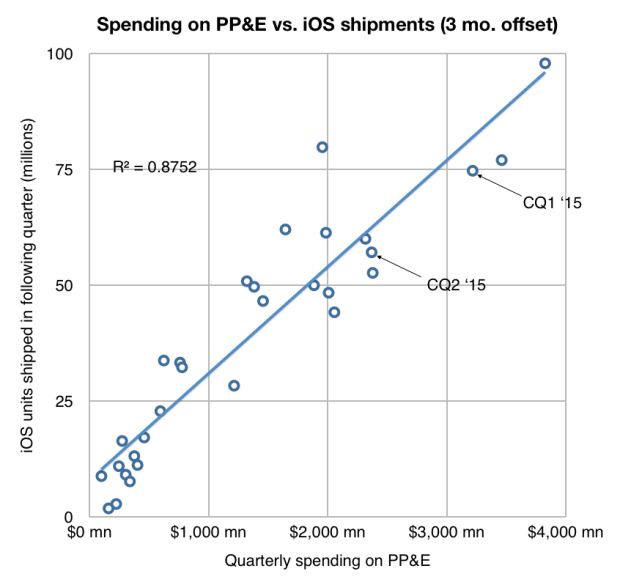
The fiscal year forecasts relative to actual spending is shown below. Note the correlation with iOS units shipped one quarter after the spending was booked.

Screen Shot 2015-05-05 at 3.08.24 PM

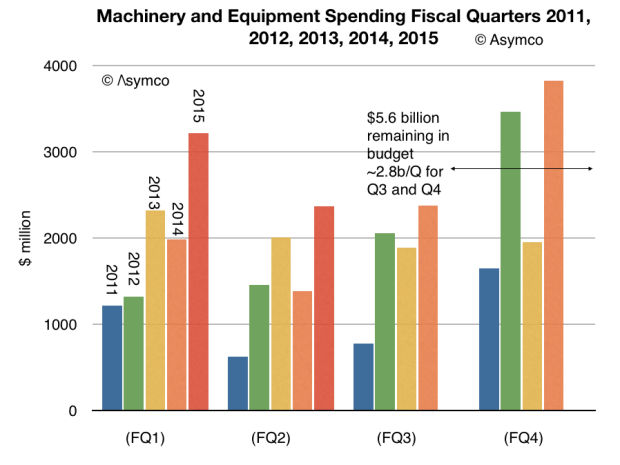
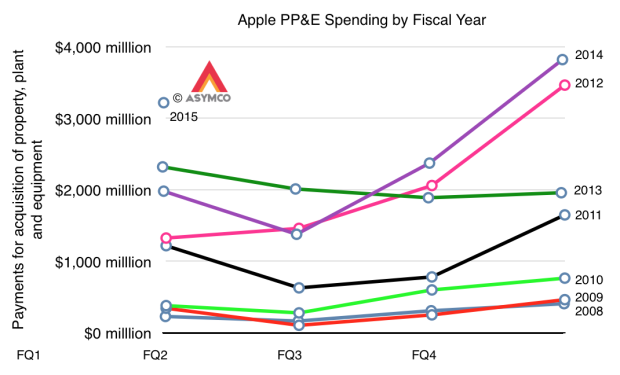
After reporting its second quarterly earnings, we received an update on what amount to half of the full year’s spending giving us only two more quarters of variability. The current projections for the next two quarters imply about $2.8 billion per quarter spending.

Screen Shot 2015-05-05 at 3.05.29 PM

The pattern from previous years is shown below for comparison. Note the Even/Odd year patterns.

Screen Shot 2015-05-05 at 3.05.35 PM


The company also offered revenue guidance for FQ3 and therefore we can even make an educated guess on the next data point (57 million iOS devices) on the following graph:


Screen Shot 2015-05-05 at 3.20.52 PM


The result is likely to be 120 million shipped between April and September.

It’s remarkably predictable.


  1. Includes land and buildings $5.6b, Machinery, equipment and internal-use software $32.1b and Leasehold Improvements $4.7b []

How will we measure Apple’s Watch success?

It won’t be easy. The company will not be reporting the Watch segment revenues or (presumably) unit sales and therefore we won’t have an accurate unadulterated view of the business. In addition, the large number of products in the mix and wide price variance means that it will be difficult for analysts to determine demand and price.

There is a hidden benefit to not having this data. All data is a creation and it tends to lead thinking in directions led by whatever is being measured (and whoever chose those measures and their motives). And yet without data there is no evidence and no credibility. In other words: You can’t manage without measurement but you can’t be sure what to measure.

The analyst is then faced with a requirement to have good taste or at least judgement about what to measure. This judgement is based on experience and good theory. Given that, what could we measure to determine whether the Apple Watch will be a success?

Here are some suggestions:

  1. Language. Measure whether “Watch” will come to mean “Apple Watch”. “Phone” has come to mean not only “smartphone” but also all mobile/cellular phones and not just things used for calling but things used for all manner of information. This is a great test because the theft of semantics can only be accomplished through a degree of ubiquity of influential mindshare. Incidentally, the brand may well have been designed to do just that.1
  2. A measurable and significant reduction in the use of the iPhone. The Watch peels off uses from the iPhone and therefore the more it peels off, the less remains. However, that which remains will be more uniquely valuable to the incumbent. This is the process of carving and erosion that the PC experienced vs. mobile devices in general.
  3. An increase in the mix of large-screen iPhones. As iPhones are removed from pockets more rarely, the larger version might be more comfortable to carry and more useful to use for the immersive tasks that are outside the scope of Watch.
  4. An overall increase in iPhone sales beyond the foreseeable trajectory. This would suggest switchers from Android would be drawn to the platform purely for the value of the “accessory”. Note that this is not inconsistent with the lower usage and higher spec mix measurements.
  5. Apps uniquely targeting the Watch. It’s hard to imagine how this will develop as it involves millions of creative minds, but as smartphones created new economic value through the solving of new jobs to be done, the Watch should do the same. As a side-effect it should lead to new empires (or at least Unicorns) being formed around Watch use.
  6. Iteration. How quickly and deeply will the product be improved? Basic accessories like headphones and Apple TV have a leisurely update cycle. Smarter devices are faster. The cycle time of iteration should indicate how seriously Apple takes the platform and that itself should be fueled by positive consumer sentiment for the product.

These indicators are vague and the data will be weakly signaled but in many ways it will be more meaningful than any financial performance figures.

  1. It leaves open the question as to what watches as currently defined will come to be known as. []

Luxurious

Apple’s new watches are priced in a pattern unlike any of the previous pricing models for Apple products.

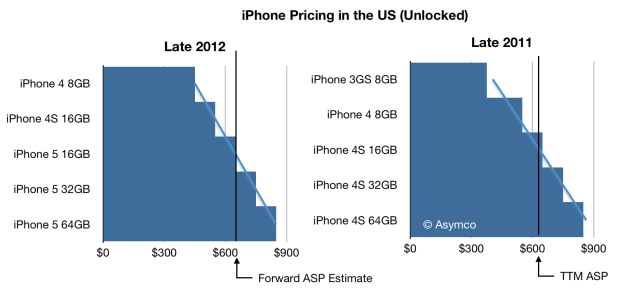
Previous pricing models for iPhone, iPad, Mac and iPod were typically structured around storage differences. The higher the storage, the higher the price. The Mac had a slight variation where processor and graphics offered some additional configuration options. To illustrate, the graph below shows typical price bands for the iPhone (2011 and 2012)

Screen Shot 2015-03-30 at 11.51.16 AMIn contrast, the watches are differentiated by size, materials and bands. There are also a total of 38 watch configurations available at launch (SKUs) and another 38 bands that can be purchased separately.

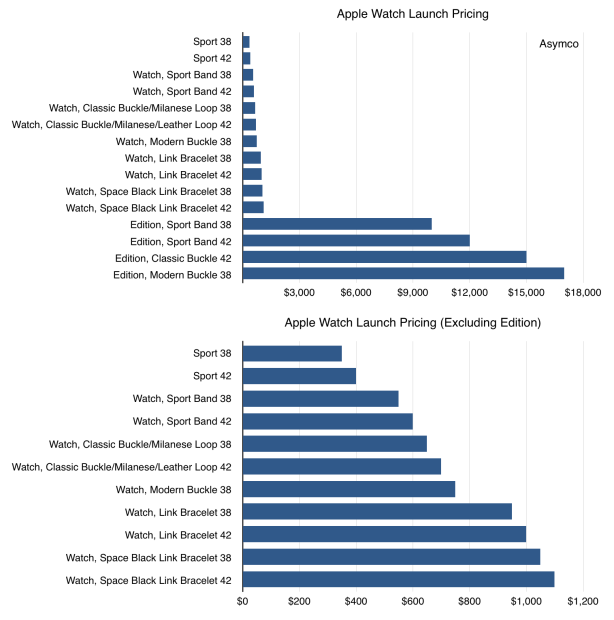
The bands come in four price points and the watches in 15. Of these 15 watch prices, four are dramatically different. The pricing of the watches is shown in the two graphs below (with and without the Edition).

Screen Shot 2015-03-30 at 12.03.19 PM

Continue reading “Luxurious”

The Analyst’s Guide to Apple Category Entry

Understanding Apple’s intentions seems to be a popular parlor game and there are many attempts at divining intention from data and market study. These attempts at market research for answers are futile because Apple does not compete in existing markets but rather it creates new markets. For instance, the market for the Apple II could not have been assessed from research into the computing market of 1974. The intention for Apple to enter into music devices and services could not have been predicted through an analysis of MP3 player market in 2000. The iPhone was also not predicated on the market for “Internet Communicators” in 2006 or 2002 when the iPad was first contemplated.1

Instead of measuring the size of pre-existing markets, surveying the functionality of existing products, or weighing toxically financialized ratios like margins and market shares, I recall this ad (Our Signature, first seen at 2013 WWDC):

This is it
This is what matters

The experience of a product
How it will make someone feel
Will it make life better?
Does it deserve to exist?

We spend a lot of time on a few great things
Until every idea we touch
Enhances each life it touches

You may rarely look at it
But you will always feel it
This is our signature
And it means everything

My interpretation of these lines, coupled with additional public statements can be used to create a “litmus test” for new product categories:

1. The experience of a product. Read: They will work on things to which they can make a meaningful contribution. To me this means that they will build things which require an integrated approach. As Apple is “the last integrated company standing” it means they will work on problems where the system is not good enough. This means that they will not work on problems where an individual modular component is not good enough. By system I mean, in the largest sense: production, design, distribution, sales, support and services must work in a seamless way. Systems analysis implies a broad understanding of the causes of insufficient performance along the dimensions of “experience”. The experiences are what differentiate the products (and lead to high margins) and these experiences are possible only through the control of interdependent modules.

2. Does it deserve to exist? Read: They will work on very few things. They will say no to many things. It’s still true that all of Apple’s products can fit on one table. That may not be true forever, but their product space will not grow as quickly as sales grow. This means that there is no notion of “marginal value” or portfolio theory where products are added because they can be justified as “moving the needle” or balancing demand. Rather, the few things which will be worked on will address non-consumption. Non-consumption of experiences.

3. Enhance life. Read: The things they release are inevitable even though nobody asked for them. The reason this is possible is that there are unmet and unidentified “jobs to be done” which are powerful sources of demand and whose satisfaction leads to unforeseen rewards. The problems that can be addressed are uncovered through a process of conversation with a few people. They are not uncovered through surveys or large n statistical studies. Without the ability to ask the right questions, big data only leads to big misdirection. In contrast, good taste in questions allows small n to lead to big insight. Apple’s ability for finding the right problem to solve comes from this greatness of taste in questions.

So given this litmus test, will Apple build a Car?

I believe the problem of transportation and its proxy, the automobile, provide all the requisite demand for Apple’s attention. Technical questions abound and they may still prove unsurmountable before a launch happens, but there are no doubts in my mind that this is a problem Apple would see fit to address.

Non-consumption of unmet and unarticulated jobs to be done can and should be addressed with systems solutions and new experiences.

The poetry is pretty clear on the matter.


  1. The market for phones was large but the iPhone pricing and features made it incompatible with any reasonable segment of it. []

How many iOS devices did/will Apple ship?

Last August I wrote:

It’s therefore reasonable to assume that calendar 2014 will see at least 250 million iOS devices sold

The actual figure was 259.5 million.

Looking ahead, the capital spending pattern so far shows a distinct rise heading into Q1.

Screen Shot 2015-02-08 at 7.33.14 PM

This could be partly due to the new campus, the new Watch production ramp and perhaps new iPad models.

Screen Shot 2015-02-08 at 7.33.27 PMNevertheless, I think it’s safe to predict that the company is on track to ship 310 to 320 million iOS devices in 2015.

Screen Shot 2015-02-08 at 7.35.30 PM


Retail in 2020

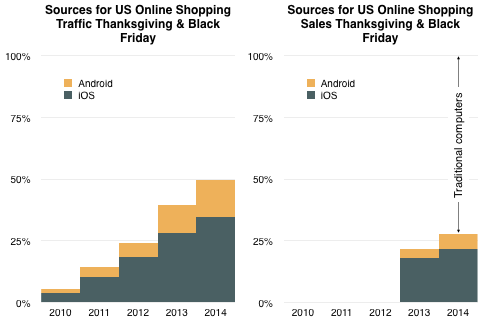
This year’s Thanksgiving and Black Friday data from IBM shows a continuing pattern of growth for mobile devices. As the graph below shows, in the five years since 2010 mobile devices grew from 5% of the online shopping traffic to 50%.  Traditional computing (desktop and laptop) made up the difference.

Screen Shot 2014-12-01 at 10.34.30 AM

The graph also shows that sales value via mobile devices crossed over 25% of online spending. The fact that mobile shopping is not equal to mobile spending is due to the convenience factor of mobile. It’s more likely that users will spend idle time scanning for bargains or tracking down ideas from friends but wait until they are at home to make the final purchase decisions in front of a computer.

The transition to spending directly from a device is a slower process, but that process was also one that online had to undertake as buyers became comfortable with online commerce. When it comes to payment, buyers are understandably more cautious.

This does not change the prediction made last year that “the transition to post-PC consumption will also be practically completed by 2020”. That leaves six years for mobile saturation and a total transition time of one decade.

At that point I expect 90% of browsing and perhaps 75% of spending to be happening on devices. Some of this will undoubtedly be enabled by biometric authentication as shown by Apple Pay. Trust and ease of use in this technology will undoubtedly accelerate the transition making mobile payments more comfortable and secure than on the legacy computer.

What is less predictable is how much those devices will also be used to transact payments for the physical retail stores. In some scenarios it’s possible that by 2020 a majority of all shopping will be enabled by devices.1 That would subjugate the retail segment to the power politics of mobile platforms.

It is interesting therefore to note the mix between the platforms in the graphs above.

  1. There is also the matter of in-store discovery and advertising via NFC and bluetooth i.e. iBeacon []

How big is iCloud?

Apple has declared that what used to be “Other Music Related Products and Services”1 plus “Software, Service and Other Sales”2 which was formerly known as “iTunes/Software/Services”3 is about to become “Services”.

“We’ll also have a category that we refer to as services and this will encompass everything we report under the heading of iTunes software and services today including content, apps, licensing and other services and beginning this month it will also include Apple Pay.”

“Services” will therefore encompass a massive amount of revenue. The reported revenues for the fiscal 2014 were $18 billion. Including all billings, the turnover in sales is over $28 billion. For next year, assuming that Apple Pay, which is just getting started, is unlikely to contribute greatly to revenues, Services turnover will top over $35 billion. That figure would make Apple Services alone one of the top 90 companies in the Fortune 500.

Screen Shot 2014-11-14 at 5.11.47 PM

Regardless, as a component of overall sales, the group formerly known as iTunes/Software/Services (shown in red above) was a modest 7% of total sales in the last quarter. Using all available information regarding downloads, payouts and reported financials, an estimate can be obtained on how this 7% is itself divisible into nine sub-segments: Continue reading “How big is iCloud?”

  1. Includes revenue from sales from the iTunes Store, App Store and iBookstore in addition to sales of iPod services and Apple-branded and third-party iPod accessories. []
  2. Includes revenue from sales of Apple-branded and third-party Mac software, and services. []
  3. Includes revenue from sales on the iTunes Store, the App Store, the Mac App Store, and the iBooks Store, and revenue from sales of AppleCare, licensing and other services []

Measuring the Apple Watch opportunity

When the Apple Watch was launched, all eyes turned to the Swiss watch industry. Analysts measured it and asked if it’s big enough to be interesting. Industry observers questioned the competitiveness of an entrant vis-à-vis the ancien régime. Marketers weighed in with segmentation hypotheses and how Apple’s queer new device might best fit.

These are all mistakes in analysis.

The market for Apple Watch is not the Swiss (or Chinese) watch market. The market for Apple Watch is the number of wrists in the world. To the extent that those wrists will be covered with Apple hardware will determine whether it is successful or not.

Measuring the existing market is a mistake because the existing products are hired for different jobs. Those measurements will yield only an answer to how big that job is.

Assessing competitiveness vs. incumbents is a mistake because incumbents have perfected solving the problems of wrist-worn timekeeping devices over a century. Apple’s watch is not a wrist-worn timekeeping device any more than the iPhone is a phone or the iPad is a pad.

Segmenting the market by whatever means are convenient today is irrelevant because the segments are currently positioned on the current jobs to be done. It’s no more relevant than classifying the iPhone along the segments defined for phones in 2007.1

Some have tried to wedge the Apple Watch among the “fitness tracker” market. This is no more plausible given that fitness tracking is no more interesting than timekeeping is to Watch.

The best way to measure the opportunity is to quantify the “wrist-space-time” continuum and deciding what is and what isn’t addressable. The wrist is an interesting place to put a computer and Apple makes computers. The rest is left as an exercise to the reader.

  1. e.g. keyboard phones, flip phones, and feature phones []

iPhone Launch Patterns

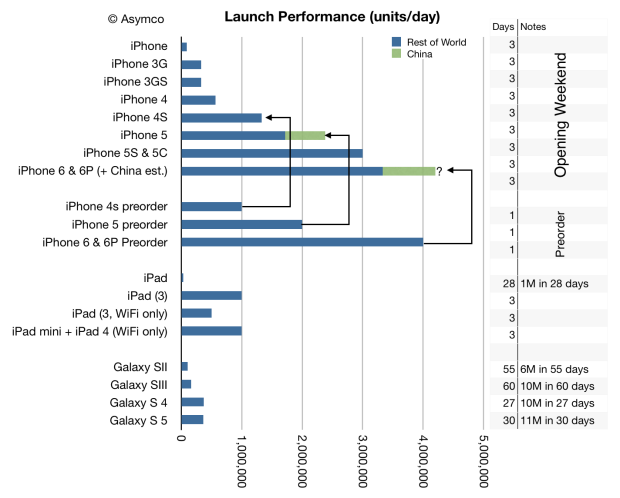
When the iPhone 4S launched, one million units were pre-ordered and 4 million units were sold during its opening weekend. That made the daily rate during the 4S weekend 1.3 million units/day or one third faster than the pre-order rate of 1 million units/day.

When the iPhone 5 launched, 2 million were pre-ordered and “over” 5 million were sold during during the opening weekend. That made the daily rate during the  launch weekend about 1.7 million which was about 15% slower than the pre-order rate. However, a few months later the 5 launched in China setting an opening rate of 2 million in three days or about 666k/day. Adding China’s rate to the Rest of World rate yields about 2.4 million/day or about 20% faster than the pre-order rate.

When the iPhone 6/6Plus launched, 4 million were pre-ordered and 10 million were sold during the opening weekend. That made a daily rate during the launch weekend about 3.3 million, again lower than the 4 million/day in pre-orders. However, just like the 5, the 6 launch excluded China. If we assume that a China launch would have run 30% faster than the 5 launch1 then my estimate of launch performance for the iPhone range is shown in the graph below:

Screen Shot 2014-09-22 at 12.35.01 PM

I included in the graph the various other launch volume data we have available.

I also included lines showing how pre-order volumes relate to weekend values for the products where we know both.

It therefore does not seem improbable that had China been available (and at the time when it will be) the iPhone launch weekend rate for the 6/6Plus combo would have been about 4 million/day. A rate consistent with the history for the product.

  1. Considering that this year China distribution includes China Mobile a 30% increase from two years ago is, in my opinion, conservative []