Reverting to the mean

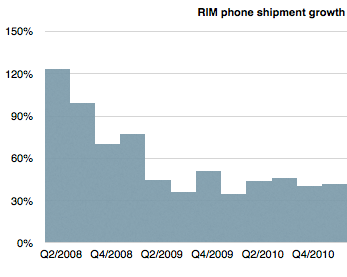
Quarterly financial data is often a lagging indicator of strategic success. RIM’s vital signs were exceptionally strong up until early 2011. Consider the following graph showing RIM’s device growth.

Using language commonly heard among analysts, one would say that the company was “reverting to the mean” and growing nearly in-line with the market. In other words, exceptional growth was over but continuing growth was likely. The company was returning to something “normal.”

However, keen observers of the market would have been hard pressed to find any reason for justifying that performance. Seen through a disruptive lens, it was evident as early as 2008 that RIM’s strategy was not sustainable. The company had a very weak smartphone product relative to emergent iOS and Android ecosystems. And yet, the company continued to prosper for nearly three years, through 2008, 2009 and 2010. Those shorting the stock during this period would have been unrewarded.

But then in early 2011 it fell off a cliff. Continue reading “Reverting to the mean”

Is the iPhone good enough?

We don’t want to just make a new phone. We want to make a much better phone.

– Jony Ive, video at iPhone 5 launch event

Disruption theory has taught us that the greatest danger facing a company is making a product better than it needs to be. There are numerous incentives for making products better but few incentives to re-directing improvements away from the prevailing basis of competition.

This danger is more acute for technology companies. Coupling incentives with the speed of improvement in various technologies (aka Moore’s law) means that over-service can come suddenly and more quickly than warnings from the marketplace. A product can tip from under- to over-shooting the market within one product cycle. One year the product is under-performing and trying to catch up to the competition and the next it’s superfluous and commoditized. The dilemma is compounded by the cycle time of development which can span multiple product cycles.

Therefore, how to tell whether a product is over-serving a market is one of the most important and frequently asked questions I get asked. It’s easy to see over-service in the rear view mirror when looking at a multi-year pattern. The trouble is that by the time you see the data, it’s too late. How do you tell you’re on the cusp of good enough, subject to imminent disruption before you get there?

I consider measuring a product’s absorbability to be a marketing problem. The marketer’s job is to read the signals from the market[1]. Determining absorbability comes down to reading two market signals, both of which must be met before green-lighting an improvement:  (a) a product’s improvements must be used and (b) a product’s improvements must be valued.

If a product’s improvements are not used and the buyer will not pay more for them then they are not being absorbed and the effort to develop the improvements should be redirected.

Now the problem becomes one of measurement. Of the two, utilization is easier. Data can be gathered on whether a feature is being used. Research methods exist to tell if a feature would be used even if it’s not available[2]

The more difficult assessment is that of the value of a feature. You can usually only tell value by trying to price it and watching what happens. For example, you add more speed/memory/capacity and try charging more (or the same) for the product. The acceptance will be measured by sales growth and will give you an indication of whether these improvements are valuable.

If you have to add features and drop prices at the same time then it’s likely that the market does not value the improvement.

But this is extremely risky. You need to wait through a sales cycle and iterate through a development cycle before you have an answer. In a space where competitors are placing opposite bets, the experiment fails even if you get the data.

How can you structure a value measurement experiment without wasting an opportunity?

Rather than dealing with hypotheticals, let’s use the iPhone as a test case. As Jony Ive states, the focus for the latest iPhone was to make it better. Is this improvement absorbable? What happens if Apple’s bet on being better is wrong?

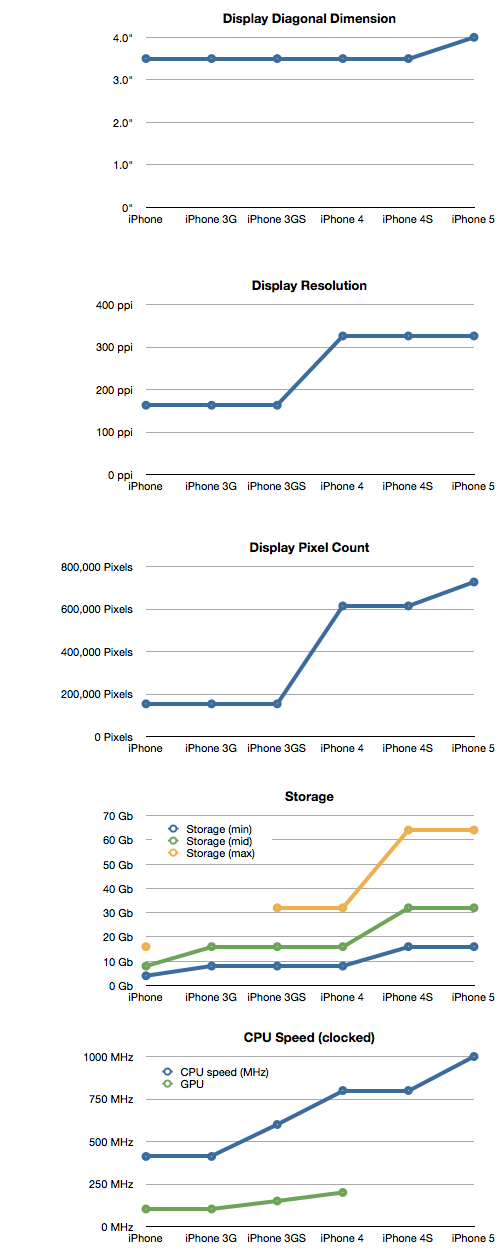
First, we can confirm that the iPhone has been on a trajectory of getting better and that those improvements have been absorbed so far. We can measure the history of performance of the product (roughly doubling every year) and we can also measure proxies for performance as I have in the following charts:
Continue reading “Is the iPhone good enough?”

5

It looks like the next iPhone will be called the iPhone 5. What’s in a name? As it turns out, quite a lot.

Every hardware product that Apple has released has had a brand and a sub-brand. Macs for example use the Mac brand and a sub-brand as follows:

  • iMac
  • Mac Pro
  • Mac mini
  • MacBook

Thus each sub-brand imparts certain meaning to the buyer. iPro, mini, book are all evocative. MacBook even has its own sub-brands:

  • MacBook Pro
  • MacBook Air

These Mac sub-sub-brands of Pro and Air are specifically designed to also distinguish and convey meaning.

iPods as well use the iPod brand followed by a sub-brand.

  • iPod Classic
  • iPod touch
  • iPod mini
  • iPod shuffle
  • iPod nano

Note how the mini  sub-brand was retired from the iPod line to be used exclusively in the Mac product line. That may not be specifically necessary or desirable but it is an interesting coincidence. (The Pro sub-brand is shared between different Mac lines)

However, when we look at the iPhone and the iPad, the nomenclature has been distinctly different. Both products have been using generational naming conventions. This implies no sub-branding as the iPhone and iPad are the only identifiers of brand and hence the only meaning being imparted to the buyer. You either get an iPhone or and old iPhone.

That changed with the iPad however. The third generation iPad became just iPad. This was deliberate (why would they want to confuse buyers?) I think there is some logic to this.

Note the parallel to the convention of the original iPod. When the iPod launched it was just the iPod. Subsequent versions were identified by a generation, but not a specific sub-brand. After the third generation iPod (still called iPod), the mini version was launched, creating the sub-brand convention that remains in use to this day. The iPod therefore was born generational but switched to sub-branding in adolescence.

The possibility exists, therefore, that there will be a sub-brand for the iPad. Perhaps “mini” is being reserved for a new iPad, to distinguish it from the regular iPad (no sub-brand) that is likely to remain in production. The logic is to make room for sub-brands when the core brand begins to cover a wider array of form factors, themselves proxies for separate use cases or jobs to be done.

So what about the iPhone?

Continue reading “5”

Samsung's basis of competition

Samsung has been selling smartphones for a relatively short time. Although the company sold Windows Mobile, Linux and PalmOS during the last decade, it did not gain significant volumes until it began selling Android phones in 2010 with strong operator support.

That support was substantial in the US. The company crashed the Android party in mid 2010 with its Galaxy brand. Trial evidence reveals that the sales level for Galaxy S1 series phones burst out of the gate taking Samsung from 90k units to 2.5 million units in one quarter.

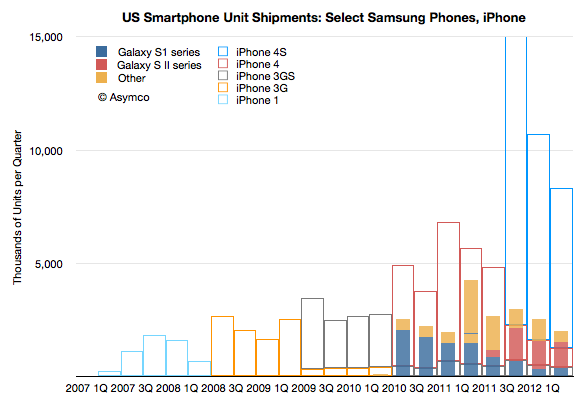
The following graph shows the unit shipments recorded by Samsung for a set of US smartphones.

Note that the profile of sales volume shows a cyclicality with respect to product launches. Each new generation overlaps with previous generations and “fills in” while the older generation product tails off in sales. This is standard portfolio strategy. It also shows the cycle time of launches is approximately four quarters. As the S1 was four quarters old, the SII launched and the SIII follows after four quarters of SII.

What is surprising is Continue reading “Samsung's basis of competition”

Apple Store Operational Economics

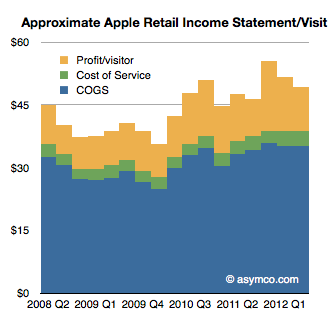
In a footnote to my last post on Apple Retail (The face and the brand) I used data on operating performance from Apple and an assumption about employee salaries (which turned out to be low) to estimate that about 7% of Apple store sales are spent on “cost of service” or the operational expenses, which consist of mostly employee salaries.

An updated view of this store income statement (on a per-visitor basis) is shown below:

To summarize the logic, Continue reading “Apple Store Operational Economics”

Asymmetric Competition

Thanks to Angel Lamuno for sending me to a dry and boring lecture by Dr. Israel Kirzner from Feburary 1988. It got me thinking again about competition and how confusing it can be.

The lecture was in part about how the word “competition” is used by economists with directly opposing meaning from that of the layman and how that leads to confusion about the role of free markets.

I won’t dwell on that, but instead I want to explain how this word can also be contradictory in meaning when applied in everyday usage in business analysis. Nowhere is this more evident than when we argue whether Apple competes with X or Y or Z.

Does Apple compete with Android or Google or Samsung? How could Apple compete with Google and yet cause it to be the default search engine in Safari thus enriching their competitors? How could Apple compete with Samsung and yet select their semiconductors for the heart of its most important and profitable product? And how could the people across the table from Apple agree to terms on these deals while being sued by them?

Some have tried to characterize this situation as “coopetition” or the co-habitation of conflicting strategies for a balanced optimum. I find this characterization uncomfortable and unsatisfying. The balance sought will be very fragile and change daily and no optimization is practically possible. It seems contrived.

Rather, I think about these situations as examples of asymmetric competition. This is competition where companies are rivals but they have different definitions of the basis of competition. In a way, they are like gladiators who have weapons which cannot be brought to bear or wielded effectively to counter the opponent’s.

Consider the following question: does the iPhone compete with the Galaxy SIII? Continue reading “Asymmetric Competition”

How many Lumia phones were shipped in the US?

The US is a crucial market for both Nokia and Microsoft’s strategies. This importance was highlighted during the launch at CES in January when not one but three CEOs (Microsoft’s Steve Ballmer, Nokia’s  Stephen Elop, and AT&T’s Ralph de la Vega) were on stage to launch the Lumia. Knowing how well this strategy is working would be very useful to understanding how this market behaves.

My first take on this was when I asked the question How many Lumia phones were sold in the US? The answer suggested through the combination of survey data from Nielsen and comScore[1] was 330,000. The figure is quite small compared to expectations. As it’s so extraordinary, it should be supported by good evidence. Unfortunately the methodology used is weak. The figure itself is probably close to the margin of error of such sampling techniques. It would be nice to have another way to calculate this.

Today Nokia offered another set of data which might help determine how many Lumia phones were shipped in the US. (Note the shipped versus sold distinction. Companies report shipments while surveys nominally measure consumption or usage.)

Unfortunately, Nokia did not offer specific data on US shipments. What they did offer was:

  • Global Lumia shipments were 4 million in the last quarter
  • Global average selling price was €186 for a Lumia phone
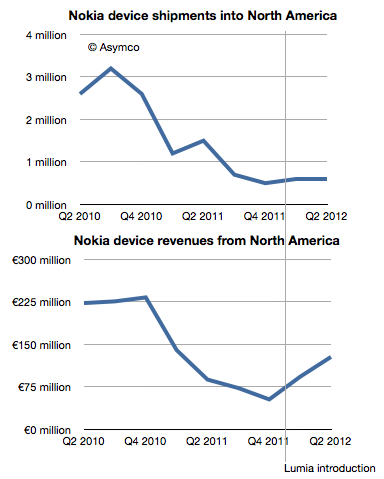
  • North American[2] phone shipments were 600k. This includes all phone types and all operating systems.
  • North American sales were €128 million.

That’s all we have. So how can this help with the question of US shipments?

As often happens, it helps to look at the data historically. The following charts show North American shipments and sales with the Lumia launch date highlighted.

While unit shipments were flat, revenues increased significantly. This suggests that we could plot the average selling price of phones in North America (NA) specifically. I did that in the following chart: Continue reading “How many Lumia phones were shipped in the US?”

Building and dismantling the Windows advantage

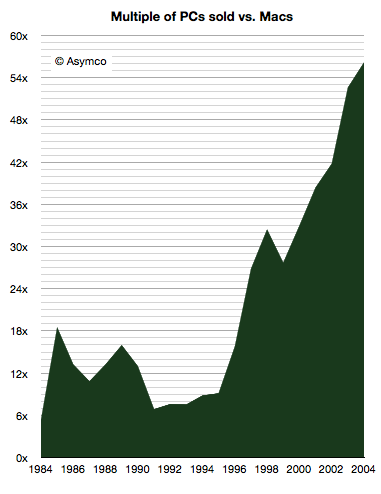
When the Macintosh was launched in 1984, computers running the MS-DOS operating system were nearing a dominant position in the market. Having launched in 1981 as the IBM PC, they were quickly cloned and four years later “PCs” were selling at the rate of 2 million/yr.  The Mac only managed 372k units in its first year.

In other words, PC was outselling the Mac by a factor of nearly 6. It turned out to be a high point. The ratio by which the PC outsold the Mac only increased from there.

When Windows 95 launched in 1995 it negated most of the advantages of the ease of use of the Macintosh and the PC market took off. The ratio reached 56 in 2004 when 182.5 million PCs were sold vs. 3.25 million Macs.

During the second half of the 90s it was already clear that Windows won the PC platform war. Windows had an  advantage that seemed unsurmountable.

I should point out that this ratio between platforms is not just an exercise in arithmetic. It’s a measure of leverage. The advantage of dominance is realized in an ecosystem which creates lock-in and additional economies in marketing. Ecosystems become self-perpetuating and there is a tendency toward monopoly. The stronger you are, the stronger you get.

Horace Dediu on HTML5 vs. native apps « uniform zulu zero zero

This week Mr. Dediu was a guest on The Web Ahead (another 5by5 show hosted by Jen Simmons) where he discussed how the forces of disruption apply to the web. It was an interesting discussion as usual, but if you’re pressed for time you should turn your attention to the bit after the sixty-five minute mark, when Horace volunteers some of his thoughts on the web vs. native application platforms.

via Horace Dediu on HTML5 vs. native apps « uniform zulu zero zero.

A fair summary of what I said and rebuttals by @falameufilho

The face and the brand

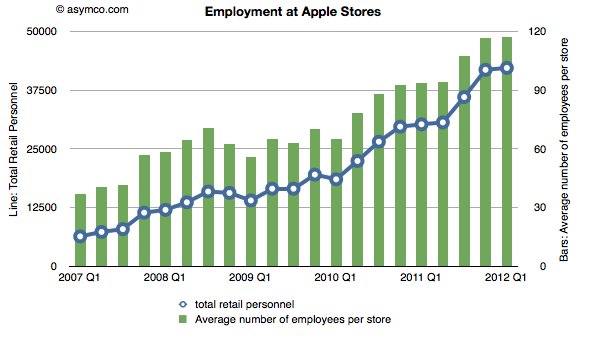
In the five years since the iPhone launched, Apple created a total of 35,852 retail jobs.

Some of those jobs came from new store openings. The total store count went from 172 to 361, more than doubling. But the growth in employment was faster: from about 6400 to 42,200, more than quintupling. This is reflected in the total number of employees per store which increased from 37 in Q1 2007 to 117 in Q1 2012.

Which brings up an obvious question:  Why did Apple triple employment at each store? Continue reading “The face and the brand”