The evolution of the computing value chain

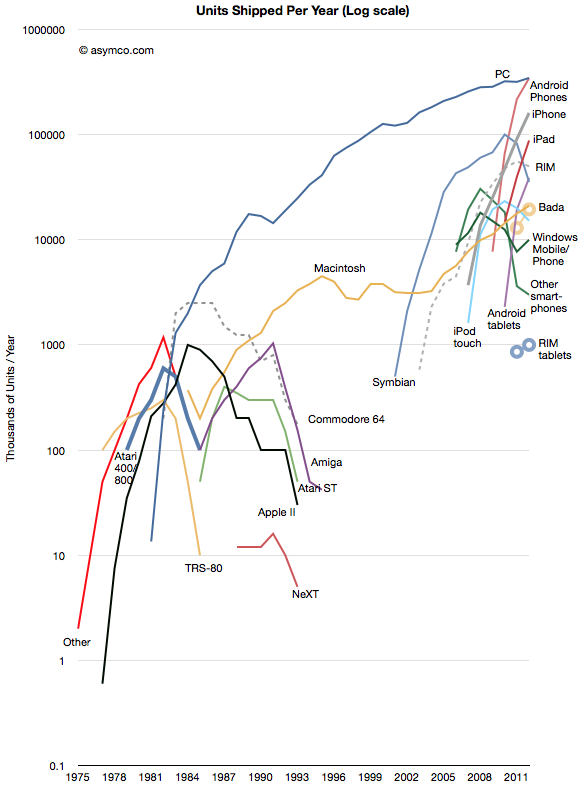
The history of personal computing has come to be defined as the history of Microsoft. At least since 1981 Microsoft’s operating systems have been the consistent market share leaders, and by a very large margin. That is about to change. This year Android will be on more devices sold than Windows. iOS is also set to also overtake Windows next year. The following chart illustrates the wave of mobile platforms that has emerged, and in spite of some notable failures, is overtaking traditional computing.

Of course we should remember that PC themselves overtook entrenched predecessors like minicomputers and mainframes which themselves overtook business computing systems based on adding machines, typewriters and slide rules. This is the cycle of disruption and there is nothing new about it.

However, it always seems to take people by surprise. Continue reading “The evolution of the computing value chain”

The highway to hell

A glance at Nokia and RIM’s market values today shows that they are both valued below book. With respect to RIM,

The company’s share price has collapsed in the past year, and it is now only valued at about $5.4 billion, down from $84 billion at its peak in 2008. Excluding its cash and the estimated value of its patents, RIM’s device business and its 78 million subscribers around the world are in aggregate worth less than $1 billion to investors.

Analysis: RIM’s new woes seen speeding loss of BlackBerry users – Yahoo! Finance

With respect to Nokia,

MKM: We are downgrading Nokia to Sell from Neutral following our U.S. retail Lumia model checks. We assume no value for the handset business and no value for the roughly four billion euros [about $5 billion] in net cash.

Nokia Suffers From Hang-Ups – Barrons.com

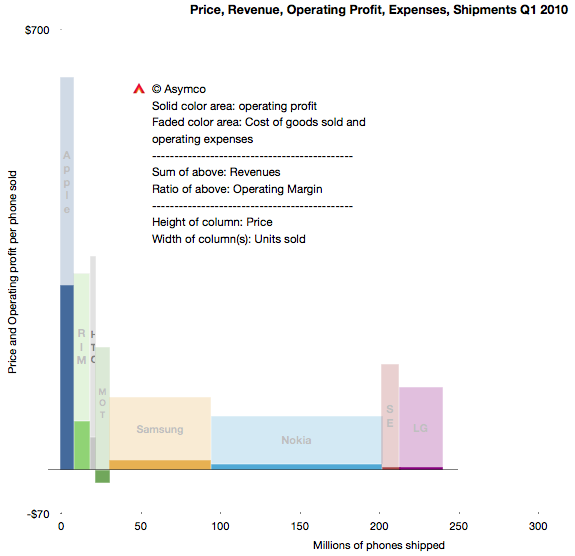
Three years ago the situation was dramatically different. RIM’s share price was six times higher and Nokia’s about four times higher. Here’s what the market looked like in Q1 2010:

This summary view shows individual competitors in the phone market as well as their combined total volumes. The profitability/volumes/pricing can be visualized as well as margins and revenues.

The same visual summary is presented for the first quarters of 2011 and 2012 below: Continue reading “The highway to hell”

Shipped and sold: A brief introduction

Markets are difficult to measure. Mainly because the information is not easy to obtain and that which is obtained is not made public. Collecting, analyzing and filling in the gaps is big business with many firms involved in selling it.

However, with all the analysts and companies selling and promoting their “numbers” it’s important to understand the difference between the methods used. There are for instance at least the following measurements:

  1. Units sold to end users. For example NPD or GfK data of retail transactions. Also Gartner’s estimates for phone units sold.
  2. Units sold to the channel. For example units recognized on income statements usually reported by companies. Also IDC’s estimates for phone units sold.
  3. Units in use. For example comScore and Nielsen survey data.
  4. Units “activated”. The measurement Google uses to describe Android performance.
  5. Intent to buy. For example ChangeWave surveys of early adopters.
  6. Utilization rate. For example browser statistics.

Each measurement tells a different story about the market but the best story is told when all data is analyzed in a combined integrated market review.

Before diving into that it’s important to understand the difference between the first and second measurements or the difference between shipped and sold.

What does “Sold” mean?

Continue reading “Shipped and sold: A brief introduction”

Interview with Bruno Ferrari of Exame magazine Brazil

My thanks to Bruno Ferrari of Exame magazine Brazil for asking the following questions. My answers were written two weeks ago on April 2nd.

Based on financial data of the first fiscal quarter, it is possible to confirm that 2012 will be the best year in Apple’s history?

Actually, it’s possible to confirm without looking at first quarter data. Every business line Apple has except the iPod is growing and is likely to keep growing during this year. That means that sales will increase over 2011, which was Apple’s biggest year. You can see historic sales growth data here:

 What are your predictions for the second fiscal quarter?

I published my predictions here.

The iPhone number seems to be higher than consensus. It’s aggressive but I’m basing my opinion on the launch of the iPhone 4S in China and the Chinese New Year and new carrier agreement there. Also the iPad will do quite well.

Do you think Apple will hold the iPhone 5 launch to September in order to open 2013 with an extraordinary result?

Continue reading “Interview with Bruno Ferrari of Exame magazine Brazil”

Why was Wall Street surprised by Apple's performance?

The Earth’s axis is tilted relative to the orbital plane it follows around the Sun. The angle is about 23.44 degrees. Because of this axial tilt, the intensity of sunlight incident on the northern and southern hemispheres varies alternatively throughout the orbit, which, by its duration, is called a “year”. This change in sunlight intensity causes weather changes. Colder when there is less light, warmer when there is more light. Life on Earth became used to this cycle and humans came to call these changes in weather “seasons”.

The warm seasons became the easier seasons for people, especially when agriculture was introduced, since that was when food grew.  Because of the geography of landmasses on Earth, humans became more concentrated in the northern hemisphere. As the northern hemisphere turned away from the Sun darkness and cold returned every year. When that darkness was at its worst people decided it was time to celebrate the return of warmth and sunshine, and thus plentiful food.

So it became very common in northern lands to celebrate the winter solstice or the darkest and coldest time of the year. The amazing thing was that all peoples did this regardless of culture or geographic location. In fact, it became common to mark the end of year at around the same time as the solstice. A new year was said to begin when the Sun began to move higher in the sky every day. The Europeans celebrated the solstice with a festival which eventually came to be called Christmas and the Chinese celebrated it as a Winter Festival which came to be called Chinese New Year.

As part of these celebrations, gift giving also became the default practice. And so, around what came to be called “December” and “January” most of the people in the Northern Hemisphere gave gifts to each other. Interestingly, as people migrated to the southern hemisphere they kept the same festival schedule so that gifting was done in what was the height of summer!

What Wall Street seems to have missed is that the gifting season is a global event spanning into January. In other words, buyers of iPhones aren’t concentrated in one part of the planet and they don’t all celebrate one single gifting festival.

The reason lies in the way the Earth is tilted and the way the continents are arranged upon it. So perhaps a better understanding of astronomy and geography would have helped investors make decisions during the past few weeks. I suggest remedial lessons for those who missed this.

Did the dividend decision affect Apple's share price?

One of the arguments made for the cause of the increase in Apple’s share price of late has been that dividends would attract more institutional investors and provide more liquidity to Apple’s shares. Can we test this argument?

We’re not dealing with speculation. The decision to start paying dividends was made three weeks ago. It makes sense to assume that this new information has been absorbed by the  markets and market participants have adjusted their positions. Funds that were previously restricted in their investment in Apple due to its lack of dividend policy, could now go ahead.

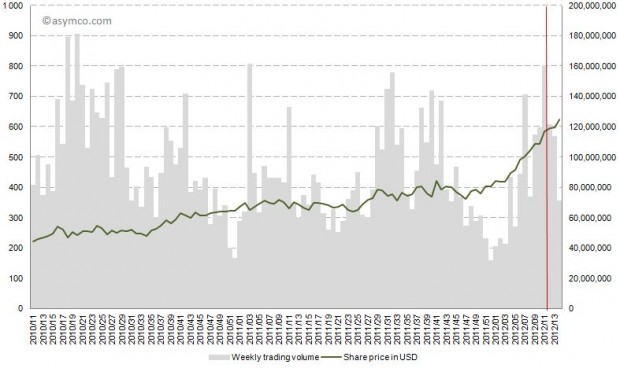
However, as the following chart shows, the share price climbed continuously before and after the dividend declaration of March 19th (shown in red). Trading patterns did not show unusual highs or lows. In fact, after March 19th the trading volume decreased on a weekly basis.

The other indicator is institutional holdings. Continue reading “Did the dividend decision affect Apple's share price?”

Apple at $600. Who knew?

Apple’s share price has increased rapidly in the last few weeks. The rise to $600 was swift and broke the pattern of slow growth the the stock was able to obtain over the past few years. The level, however, shouldn’t have been a complete surprise.

I think Apple is going to $600…It’s really not that complicated. Apple has a number of key drivers in its business model which have yet to be properly priced into the stock because I think it’s very cheap at this level.

-Stephen Coleman, chief investment officer at Daedalus Capital

This prediction was made October 26, 2007. On that date Apple’s share price closed at $184.7. It may have seemed like a bold bet, but as Coleman noted, the reason why it would reach $600 was easy to spot.

The real story on how I get to that valuation doesn’t even involve the sale of (the Leopard operating system) or the growth in the Mac business. How I get there is through the iPhone itself.

What was not easy to tell was when it would reach $600. Continue reading “Apple at $600. Who knew?”

What is disruption and how can it be harnessed?[1]

The phenomenon we call business disruption could benefit from a different name. Although it signifies a disturbance or an interruption in an industry, it’s much more than that.

The nominal definition I work with is that disruption is the “transfer of wealth in an industry from dominant incumbents to disadvantaged entrants.” It’s a convenient definition because it’s brief, it puts the emphasis on economic value and because it alludes to a reversal of fortune and the implied extraordinariness.

However, there are several nuances lost and contradictions ignored in this definition. I want to enumerate them here and now:

  1. Although in a disruption there is a transfer of wealth, that wealth is not necessarily conserved. An industry that undergoes a disruption often emerges larger, more productive or more influential. Disruption typically creates net growth.
  2. Although extraordinary and spectacular it is also very commonplace. Disruption is not rare. In fact, it rarely fails to happen. One could even say that if it does fail to happen, it’s a symptom of an industry in crisis.
  3. Being so common, it can be seen as a regular occurrence. But if the regularity of disruption can be considered to have a clock cycle, its frequency is increasing.
  4. Disruption in the literal sense implies discomfort, displacement and even destruction. But it’s necessary to the health of any economy. The analogy to biology is that death is the most important thing in life.
  5. Although only recently characterized and studied in cases set in the past century, the pattern is evident throughout history.

I’ve offered examples of these consequences or side-effects of disruption but I’ll emphasize once more the example I’m most familiar with. To illustrate the primary definition, the AMP index is a measure of the success of one company relative to a set of peers in the mobile phone industry. It’s the average of four market shares: mobile phone units, smartphone units, revenues and operating profits.

This chart shows the shift in AMP index values for the competitors whose data is public and which make up the vast majority of units sold: Continue reading “What is disruption and how can it be harnessed?[1]”

The new feeds and speeds: iPad vs. MacBook Air and iMac

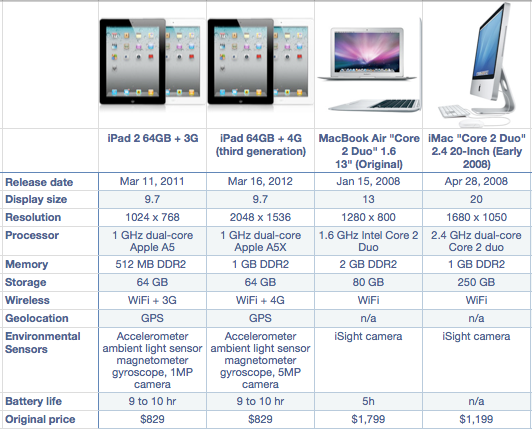
At last year’s iPad 2 launch, I compared the specs of the newly announced iPad with those of a laptop and desktop from five years earlier. This year I am comparing the new iPad with Apple’s computers from four years earlier:

The new iPad now exceeds the total display resolution, has similar speed and storage capacity while having twice the battery life of the thinnest laptop of four years ago. It also has very high quality cameras and GPS and cellular network connectivity which have yet to appear on mainstream PCs. It’s still a lot smaller and half the price and has a larger selection of available software titles at prices a fraction of its elder cousin.

Continue reading “The new feeds and speeds: iPad vs. MacBook Air and iMac”

How much does it cost to manufacture an iPhone?

An iPhone generates approximately $650 in revenue for Apple. This figure has remained fairly steady over time. Using deduction from overall margins, it’s possible to estimate the gross margin on the product to be around 55%.

That means that the cost of goods sold (COGS) for the iPhone is about $293. Is that a lot? Where does that money go? What else does it tell us about how the company operates?

To find out we need to understand the cost structure of phone building.

Typically there are four main categories of costs for a phone:

  1. Bill of materials (BOM). This represents the cost of the components that go into the device. These are paid to suppliers.
  2. Transportation/warehousing. This is the cost to transport and store the product before sale. This is paid to shipping companies and warehousing.
  3. Manufacturing cost (including labor). This is paid to contract manufacturers.
  4. Warranty expense. This is paid back to customers for returned product that can no longer be sold.

We can estimate a device’s BOM through a teardown analysis Continue reading “How much does it cost to manufacture an iPhone?”