Citizen Publisher

In March this year Richard Stengel, managing editor of Time magazine, was speaking about the iPad.

For a while many movies were more like filmed plays, until directors really learned to take advantage of the opportunities of the medium. For the iPad “The medium is waiting for its Orson Welles.”

The idea that a new medium needs a new media is not novel. The implication that the new media needs a new genius to define it also follows naturally. However, the implications of new media for the creative industries that are built around them are more difficult to perceive. How are the structures of these industries shaped by disruptive innovations?
Continue reading “Citizen Publisher”

Re-framing the dichotomies: Open/Closed vs. Integrated/Fragmented

Google likes to market itself as “Open” in contrast to “Closed” alternatives.

Apple likes to market itself as “Integrated” in contrast to “Fragmented” alternatives.

These dichotomies are judgmental and meant to portray “us=good” vs. “them=evil”. Neither gets to the point of how the two companies are structuring their businesses relative to the mobile computing value chains and clouds the judgement of observers.

I propose using a more informative and less judgmental distinction. It’s a division defined clearly by Clayton Christensen in his classic “The Innovator’s Solution” from 2003.

He introduced the concept of interdependent vs modular systems. Continue reading “Re-framing the dichotomies: Open/Closed vs. Integrated/Fragmented”

Back to the PC

Apple’s “Back to the Mac” was a clever play on words. Everyone expected it to mean that the event was going to focus back on new Mac products.  As we had been so steeped in iDevice news the Mac was feeling neglected. It was time to take the discussion “back to the Mac.”

Instead Apple told us that the Mac and OSX were going to become more like Devices and iOS. iOS innovations were what’s going “back to the Mac”

So it wasn’t “back to talk about the Mac” it was “OSX went to iOS and iOS is going back to OSX.” The strategic upshot of it is that “the Mac is an extension of the device portfolio.” Heady stuff. We’ll need to chew on this for a while.

But some implications are easy to foresee. For example, the consequences for competitors. When Apple launched the iPhone, competitors followed suit, powering their phones with a variety of “open” operating systems. When Apple launched the iPad, competitors followed suit, powering their devices with a variety of “open” operating systems. These reactions to Apple’s initiatives by dozens of “open-wielding” competitors are all being touted as the inevitably winning strategies.

So, as we’ve observed all of Apple’s strategies being copied, I can’t wait to see the competitors follow its “back to the Mac” strategy:

  • It won’t be long before Dell takes UI and hardware design elements from the Streak “back to the PC.” Think of the magic that will happen when Android Froyo “hooks up” with Windows 7.  Both Android and Windows being “open”, if I squint hard enough I can just visualize the tweet from Andy Rubin of the command line to build a new Windows  8 with Android mojo. The Android Market selling Windows Apps. It will be beautiful.
  • Or perhaps we’ll soon see “back to the Blackberry” as RIM takes QNX interface elements back to their core business. Not so sure about the command line make statement there.
  • Or maybe Nokia will announce “back to Symbian” as they take gestures from the ultra-open MeeGo to do an evolution of their majestically open Symbian.

These initiative will surely be helped by the vast community of open developers surging to support the great open merged PC/tablet/device future.

As a clue to the sarcasm challenged: The power of Apple’s integrated approach across its product lines goes deeper than the user experience.

The imminent demise of killers

Before proclaiming the death of a company or product it’s important to understand what makes it live. I’ll illustrate with a personal experience.

I was once asked to comment on a product designed to be a “Blackberry killer”. Much like the latest Droid Pro, the product looked like a Blackberry. It had a monoblock keyboard and a nearly square screen. It was, in other words, a product designed for thumb typing emails.

The backstory is that, like many phones, the requirements came from operators. At the time, Continue reading “The imminent demise of killers”

The cognitive illusion that is iPhone n-1

How do you think about the iPhone 3GS after the iPhone 4 is out? I have a hypothesis that it’s not what it seems.

The standard logic is that the 3GS (which I will call the n-1 where n is the current phone version) is a lower-priced leftover that covers a lower price point and expands the market.

I think it’s designed to give the illusion that the iPhone 4 is actually more desirable steering more potential buyers to the new (nth) phone.

To illustrate I’m going to call upon the wonderful example given by behavioral economist Dan Ariely at the TED talks. Continue reading “The cognitive illusion that is iPhone n-1”

Correlating Innovation and Share Prices

In the last article on the P/E ratio vs. Growth for some of the largest companies, the question of PEG came up. PEG is the P/E over Growth and it’s a good way to index valuation relative to growth. Usually Growth is measured as the forward twelve months consensus and a PEG of 1 is, as a rule of thumb, considered “fair value”. However, forward growth is based on possibly inaccurate analyst consensus. If we instead look at historic growth, we have some actual performance to evaluate. Let’s call this PEhG for P/E over historic Growth.

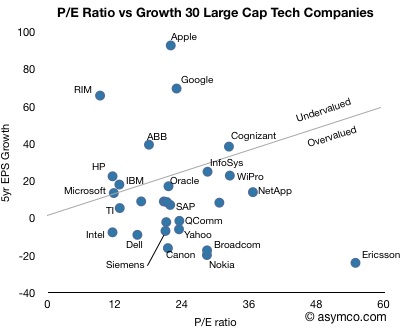
The following chart shows 30 large cap technology companies[1] and their five-year compound EPS growth vs. their current P/E multiples. If we draw a line at the PEhG of 1, i.e. when the P/E ratio is equal to the historic growth rate and split the pack into PEhG > 1 (overvalued)[2] and PehG < 1 (undervalued), we have the following split:

The chart makes for an interesting Continue reading “Correlating Innovation and Share Prices”

Apple's growth vs. top 10 largest market caps

Apple’s stock price has been rising. Although it’s still priced at a P/E of 22 while facing near term EPS growth well above 50%, this is belated recognition of the potential of the iPad and the iPhone.

However, as it has grown, Apple’s valuation is now not only higher than any other technology company but it’s nearly the most valuable company on the planet. There is a theory that ultra-large market caps are reserved for companies that are past their prime. Sometimes this is attributed to the law of large numbers: that conclusion that big numbers cannot grow much bigger because compounding growth is exponential whereas markets are limited and become quickly saturated.

The trouble with this theory is that “large” is relative; large is often simply “the largest”. Large market caps are not what they used to be. During past booms, large caps touched a trillion dollars. Today, the largest market cap is merely $314 billion.

So I don’t put much faith in large number “laws”. The real question of under/over-valuation rests on whether the company is growing or not. Valuation is simply the net present value of future free cash flows (plus assets). So the most important determinant of current value is growth in cash flows.

It’s fairly easy to assess this: compare P/E which is a proxy for valuation with EPS growth. The following chart does this for the top ten largest market caps traded on US exchanges (as listed by finance.google.com).
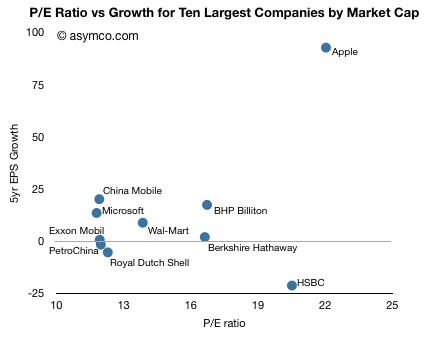
One should see some correlation between the two variables, but given the 5 year time frame, many of these companies showed large volatility. There are outliers like HSBC which has a rapidly rising value even though it was badly affected by the credit crunch.

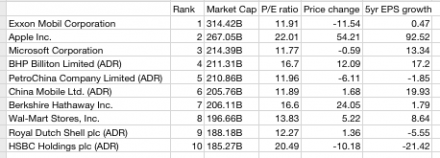
The other outlier is Apple. The company showed 93 percent EPS growth over a five year period and has a P/E of 22. The company with the next highest total value (Exxon Mobil) had 0.5% growth with a P/E of 12. The company with the next lowest total value (Microsoft) had 13.3 percent growth with a P/E of 12.

For an ultra-large cap, Apple’s growth is unprecedented and extraordinary. It’s in fact off the scale. The average growth of the other 9 top caps is 3.6 percent!

Apple’s growth is a factor of 25x higher. The P/E is only 1.6x higher.

The result has been a much higher appreciation in the stock price as shown in the following chart.
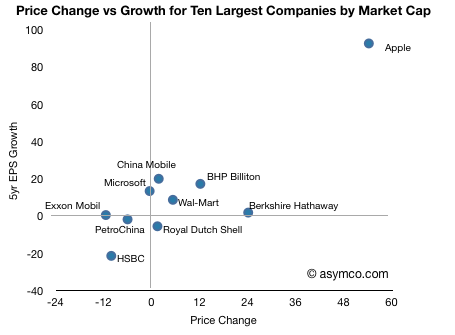
So it’s clear that Apple, in this peer group, is far from ordinary.

Data follows: