Apple Assurance

Apple is categorized as a vendor of consumer electronics. More specifically, a member of the “Electronic Equipment” industry in the “Consumer Goods” sector. If indeed this is what it’s thought to be selling, there is a problem because it isn’t  what its customers are buying.

Apple’s customers buy a mix of hardware, software and services under a brand that assures a certain quality of experience. This bundling and integration of otherwise disparate things is why the brand is such a success.

This anomaly between what Apple is thought to sell and what buyers actually buy can leave the casual observer confused. As a result the company’s categorization as vendor of hardware deeply discounts its shares. It is, in other words a less valuable business. This is because a seller of consumer electronics does not benefit from “system valuation” since there is minimal loyalty to the product after the sale.

The consumer electronics vendor has no network to leverage, no ecosystem adding value after the sale, no platform and works through multiple levels of distribution to reach the customer. In contrast, a system vendor can expect benefits from network effects, ecosystems, and a coveted relationship with the end user.

The result is that the valuation of a consumer electronics vendor is based on the momentum of individual products. Apple has always been valued this way. Each hit product is considered to be a stroke of luck/genius and the chances of recurring are discounted to about zero. Regardless of the fact that it has a track record of “home runs”, Apple’s hit rate is not considered sustainable.1. Certainly Apple is not valued as being able to generate reliably recurring revenues.

But what if we were to value Apple on the basis of what people are buying rather than what it’s thought to be selling?

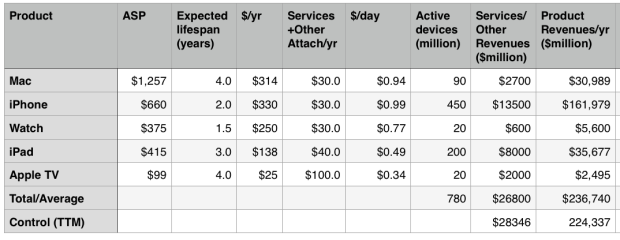
The model is simple enough: determine the number of users, estimate the lifespan of the products, and figure out the services attached to the products; then, given the price, obtain a price per product per day. You then can get a recurring revenue figure.

I did just that and the results are in the following table:

Screen Shot 2015-09-15 at 5.13.27 AM

Continue reading “Apple Assurance”

  1. The P/E ratio is the primary indicator in this analysis []

The one where I offer stock tips

Let’s say I offered you the option to invest in a monopoly or in a hit-driven company whose survival depends on always finding the next big thing? Which would you invest in?

Before you answer, let’s say I offered you the option to invest in a person who has a large inheritance or a person who is poor but is hustling for any opportunity. Whom would you invest in?

Before you answer, let’s say I offered you the option to invest in real estate of a city which depends on a stable, capital-intensive manufacturing base or one where they make nothing but movies. Where would you buy land?

Each of these reflect the same choice: stability vs. instability, the known vs. the unknown.

Historically, capital has always gone toward the stable and away from the unstable. Wealth has gone the other way.

Onward.


Breaking the Law

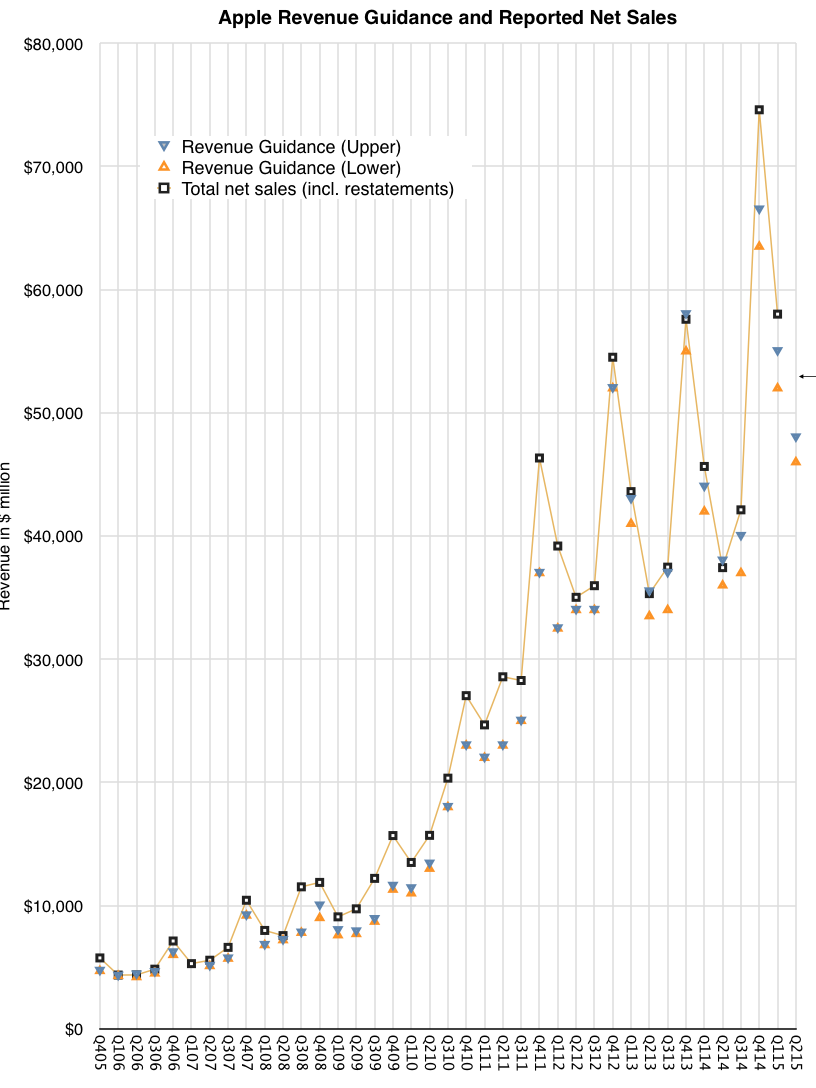
For the first time in many years I feel that there is some potential uncertainty in the results Apple will announce. After a period of excellent accuracy (shown in graph below), the company’s guidance has begun to diverge dramatically from reality and the trend might continue this quarter. The cause might be unanticipated demand for the iPhone 6/6 Plus. The growth rate for the product was 46% in Q4 and 40% in Q1. This is unanticipated because growth rates have been below 20% for five quarters and below 50% for eight.

Screen Shot 2015-07-13 at 12.21.00 PM

This slowing of growth was explainable given the rate of diffusion of smartphones in the global population. Within the US and some other early adopting economies the market is reaching late stages where most people have switched to smartphones. Globally we are at a more modest 30% or so but in many of the late adopting economies Apple does not have wide distribution.

Of course this thesis is thinly supported. There are many reasons to think that late adopters would still start with iPhone and that earlier adopters of Android would upgrade to iPhone after a few purchase cycles. Thus, the iPhone could prosper in later-adoption or even in post-saturation states of the market.

Indeed, in the post-saturation PC market, Apple is doing very well with the Mac and in the late to post-saturation MP3 player market the iPod did extremely well. This suggests that when it comes to value capture brand, experience and satisfaction trump function, price and share considerations in almost all consumer markets1

With so many assumptions put asunder the iPhone business suddenly looks downright lively. I adjusted my own growth assumptions and the resulting figures are shown below. Continue reading “Breaking the Law”

  1. Enabled by design for jobs to be done. See non-technology markets for abundant evidence of this. []

Where are Maps going?

At the 2015 WWDC Apple stated that it receives 5 billion requests per week for its maps service. It also said that Apple maps is used 3.5 times more frequently than “the next leading maps app.”

These two data points are the total number of data points we have about the global maps market. Neither Google nor Nokia provide usage or share or performance data. Regardless, commentary on the usage, share and performance of Apple Maps has been abundant for the three years since its inception.

The data presented allows us to make a few estimates for the first time and we can hope that additional data can allow a picture to emerge of where maps are going.

With these first two data points we can finally make some estimates. But some assumptions are still needed: We need to assume that the “next leading maps app” is Google Maps. Although there are other maps apps on the iOS platform they are probably insignificant and it’s a two-horse race between Google and Apple on iOS.

This means that the 3.5:1 split in usage results in a 78% share for Apple Maps and a 22% share for Google. If we assume that there are about 400 million iOS users of maps1, it leads to about 90 million Google Maps users on iOS and about 310 million Apple Maps users on iOS.  This includes iPad.2

Given that Google also reported 1 billion downloads in 20143 we can assume between 25% to 33% Apple Maps “market share” of usage.

Continue reading “Where are Maps going?”

  1. Note that not all iOS users are maps users. Maps are not used by all users []
  2. We are excluding OS X use of Maps. []
  3. though not necessarily all of these downloads lead to active use, obviously []

Is Tesla Disruptive?

To the analyst, the car industry is a wonderful study. Unlike some other “high technologies,” whose market births and deaths are separated by a few changes of the seasons the automobile industry has been around for well over a century. It has been sustained through dozens, perhaps hundreds of innovations. Almost everything about the car of a century ago has been improved.

Not only improvements to the product itself but improvements to the infrastructure that supports it: roads, gas stations, services, insurance, regulation. At the same time, its numbers have increased steadily as the car has spread to all corners of the world through waves of increased production and distribution. Although invented in Europe, the production system that allowed it to reach the mass market took hold in the US. That production system was then exported to Europe then to Japan and then to Korea and now to China.  Screen Shot 2015-05-28 at 5.30.54 PM
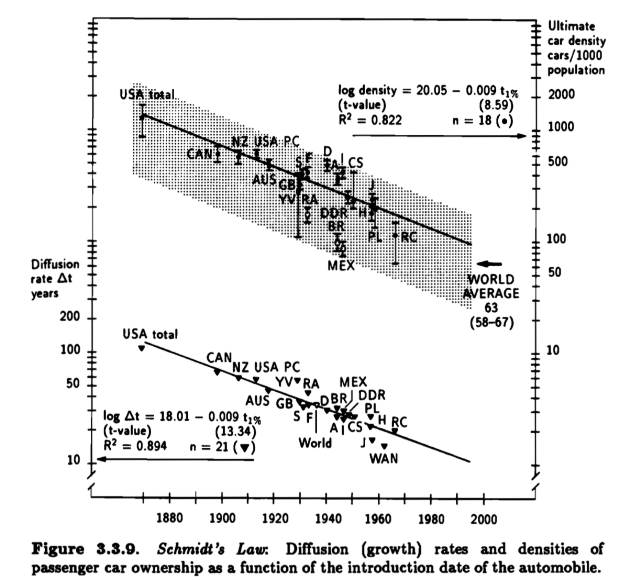
Figures 3.3.9 and 3.3.10 from Arnulf Grubler’s The Rise and Fall of Infrastructures

However, throughout this century of improvement, the business structure—the way money is made—has not changed. Even with the arrival of Volkswagen in the 1960s and Japanese automakers in the 80s, the network of incumbents has not been displaced. Newcomers have taken share, but there have been few exits suggesting that classical disruption has not taken place.

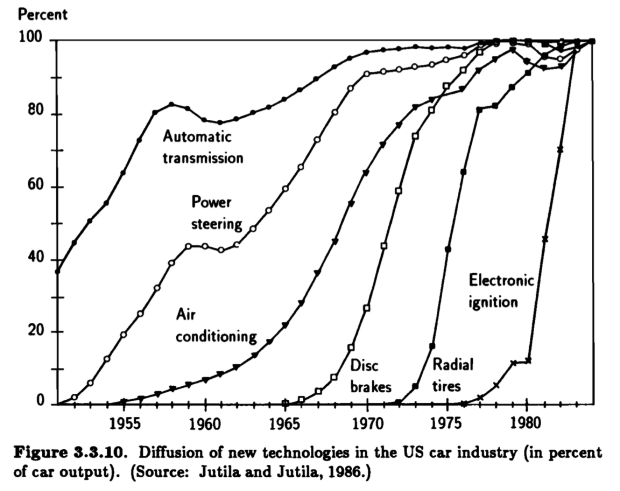
When we look at the reasons for the share displacement that did take place, we see innovation in production systems and distribution as the core causes. We see new manufacturing processes and competition against non-consumption. What we don’t see is new technologies. We don’t see diesel engines or anti-lock braking or crumple zones or fuel injection or radial tires or airbags or automatic transmission or air conditioning or electronic ignition or safety glass, or any of the other hundreds of technologies that have been adopted as causing any change in market share.
Screen Shot 2015-05-28 at 5.32.41 PM

Every innovation tends to diffuse rapidly throughout the industry, being widely adopted by all manufacturers. Production systems such as the ones from Ford and Toyota have been much slower to be adopted which has offered those innovators an advantage for a few decades, but they too have eventually been widely copied and created normative behavior. The opening of new markets like Asia, Eastern Europe, Latin America, Africa and China have created opportunities for local manufacturers but eventually those advantages too have or will be diminished with time.

So, given this, we have to ask if the the availability of new power storage technologies would allow an early mover to displace and move aside these established makers. To answer in the positive would imply that the challenger has an asymmetric business model—one which causes the incumbents to flee in the opposite direction. But Tesla is manufacturing cars using the same JIT processes and ramping quite slowly. Toyota-style process-driven innovation does not seem to be even in the works. There is no shortage of manufacturing capacity, indeed there is too much.

Furthermore, Tesla is selling cars in established markets competing against existing consumption. Volkswagen Beetle or Model T style competition against non-consumption does not appear to be on offer.

Tesla’s product introduction rate is relatively sedate, so a higher rate of product development which might let them “turn inside” the incumbents, does not seem likely.

Finally Tesla is introducing products priced well above average appealing to the wealthiest of customers, again causing us to ask how this might cause a luxury company to look at their solution and exclaim “Not for us!”.

Looking from every angle I am unable to find the way that Tesla is asymmetric. Disruption theory suggests that whatever causes it to survive or prosper will be embraced and extended by competitors precisely because it will also cause those competitors to survive and prosper.

The auto industry may be a lot slower than the computer industry to respond. But once the industry embraces battery-based power, it will convert a world-wide production and distribution system to sustain itself.

That does not mean Tesla is a bad business. They may carry on with Porsche-like or even BMW volumes for a long time. But that’s not a disruptive outcome, it’s a niche strategy.

There is one more point. As Tesla has chosen to share its intellectual property and as Elon Musk has stated publicly, they welcome others to build the same cars they do. So by their own admission the company does not seek to disrupt. Disruption is a competitive stance.

Unicornia

Unicorns typically are valued on the basis of number of users. While they are not yet monetizing those users, their growth and engagement metrics are expected to be off the charts. As there are no revenues (or profits) the $billion valuation hinges on a nominal value of $/user. That figure is based on comparable companies (e.g. Facebook) which do monetize their users.

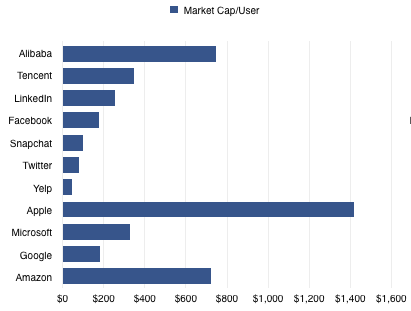
Since the unicorn’s capitalization/user defines its valuation, which company should be considered comparable? Unfortunately they range widely. There are many alternatives. The graph below shows a few Market Cap/Mobile User rates ranging from $45 for Yelp to $747 for Alibaba.

Screen Shot 2015-05-15 at 5-15-2.47.16 PM


Note that I’ve also added companies which may not be considered as unicorn comparables because they are not usually valued on a per-user basis. Apple, Microsoft, Google and Amazon are priced by product sales, typically. However, most of them operate and self-define as service organizations. Microsoft has been “monetizing users” for decades using a recurring revenue model. It has a “SaaS” business logic for most of its revenues. Google1 likewise. Amazon reports its active users every quarter and obviously is measuring itself by that metric.

Apple2 is the least likely to be seen as a company whose value is a function of user base. Nonetheless it behaves entirely on that basis. The company’s entire strategy depends on satisfying its customers and building its brand which can only have one outcome: loyalty and repeat purchases. The services and software they offer can be seen as supporting that brand loyalty which is converted to profit through an above-average selling price.

Being mature of business model therefore does not exclude a company from being valued like all the kids are these days.

So, if we do look at the value/user metric we might as well look at the revenues, operating profit and growth data. Continue reading “Unicornia”

  1. Google users are estimated at 2 billion active Android/GMS devices []
  2. The assumption here is that Apple has 520 million active users which is based on iOS devices in use estimates []

The Battle for The Wrist

The Apple Watch offers a hierarchy of surfaces onto which software can compete for attention:

  1. The Complication Layer
  2. The Notification Layer
  3. The Glances Layer
  4. The App Screen

These surfaces are arranged in a hierarchy where the highest is the most accessible and the lowest is the least accessible. In a similar fashion we can consider the hierarchy of screens a person could reasonably be considered to be exposed to:

  1. The Watch
  2. The Phone
  3. The Tablet
  4. The TV
  5. The Personal Computer
  6. The Public/Work Computer

Note that this hierarchy is correlated to the size and hence the portability and persistence of proximity to the user. Each of the screens has its own “surfaces” which expose software to the user with various degrees of ease. For instance the iPhone has Notifications, Control Center, Home Screen, etc. The OS X personal computer has the Desktop, Notifications, the Dashboard, the Browser etc.

It follows then that software which is located at the top of each hierarchy on each device will have the greatest exposure to user interaction and that the device which has the nearest proximity to the user will provide the greatest value to software developers.

This implies further that the most valuable “real estate” for software will be the Complication layer on the Watch.

The software which receives either default placement there or which convinces the highest number of users to opt for placement there will have the greatest potential value. As suggested in my post on how the Watch will be valued, how software will be valued will be by the probability of its Settings being enabled for display on the Watch and its presence within Glances.

The jostling for position within the constrained real estate on the wrist will be analogous to the competition for positioning on the phone. You’ll note that the winners on the phone were different than the winners on the PC. My bet is that the winners on the Watch will be different than the winners on the Phone.

And that’s not a bad thing.

The Watch

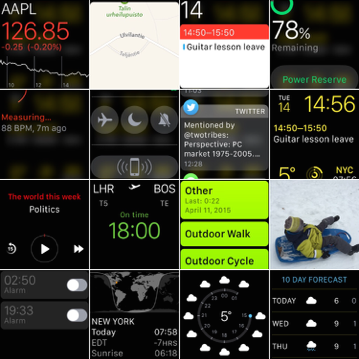
Watch Screens

Before its launch, I said that the Apple Watch would be as much a watch as the iPhone is a phone. Recall that when the iPhone was launched it was anchored on three tentpoles, one of which was being a phone and that when the Apple Watch was launched it was also anchored on three tentpoles, one of which was being a watch.

Realizing that on the iPhone the “phone” is but an app — one which I find populated with FaceTime calls rather than cellular calls and whose messaging history is filled with iMessage threads rather than SMS — I consider it safe to say what the iPhone is today not as much a phone as a very personal computer. And so the question is whether the Watch will quickly leave behind its timekeeping anchor and move into being something completely different.

I had the chance to use the Watch for a few days and can say that timekeeping is probably as insignificant to its essence as it’s possible to be. It feels like a watch in the physical sense, looking good in the process (as the iPhone physically felt like a phone, also without being hard on the eyes)

However it does not feel like a watch conceptually. I find myself drawn into a conversation by its vocabulary of vibrations. I find myself talking to it. I find myself listening to it. I find myself glancing at information about faraway places. I find myself paying for things with it. I find myself checking into flights with it. I order transportation, listen to news, check live data streams and get myself nagged to exercise. It tells me where I am. It tells me where to go. It tells me when to leave.

Nothing ever worn on a wrist, or anywhere else for that matter, has done any of these things before. Not only are these things mesmerizing but they are done in a productive way on a wristwatch. In other words they are done in a mindful way.

Cynics may say it does too little. Philistines may say it does too much. But for me it does just what I want it to do when I want it done. The things which are not done stay out of the way. This discretion is just as important as the effectiveness of action.

Even more remarkably, this tasteful minder is offered not to a fortunate few but to millions of people of average means. In the true sense of technological democratization, Apple Watch is a phenomenon for mass consumption.

Its launch needs to be understood as a watershed event. It could be compared to the launch of the Mac or the iPhone but it is different as much as it is the same.

The product has a completely different character. It tries not to do more but to do less. But that which it does is more meaningful, more thoughtful. We talk of computing speeds and network feeds but we spend much more time and money to visit people who have little to say and say it slowly. We value charm and wit more than bandwidth and throughput. We are drawn to beauty more than to speed. This is what this computer captures.

A maxim of the computing of the 21st century is that the closer the machine is to us the more we value it. It does not get rewarded for being fast but for being a companion. It does not get valued for features but for beauty. It does not get hired for power but for control. It does not get worn because it’s smart but because it’s clever.

People understand these tradeoffs instinctively. They are not concepts that need selling. The product speaks plainly of itself and its success is therefore guaranteed.

How will we measure Apple’s Watch success?

It won’t be easy. The company will not be reporting the Watch segment revenues or (presumably) unit sales and therefore we won’t have an accurate unadulterated view of the business. In addition, the large number of products in the mix and wide price variance means that it will be difficult for analysts to determine demand and price.

There is a hidden benefit to not having this data. All data is a creation and it tends to lead thinking in directions led by whatever is being measured (and whoever chose those measures and their motives). And yet without data there is no evidence and no credibility. In other words: You can’t manage without measurement but you can’t be sure what to measure.

The analyst is then faced with a requirement to have good taste or at least judgement about what to measure. This judgement is based on experience and good theory. Given that, what could we measure to determine whether the Apple Watch will be a success?

Here are some suggestions:

  1. Language. Measure whether “Watch” will come to mean “Apple Watch”. “Phone” has come to mean not only “smartphone” but also all mobile/cellular phones and not just things used for calling but things used for all manner of information. This is a great test because the theft of semantics can only be accomplished through a degree of ubiquity of influential mindshare. Incidentally, the brand may well have been designed to do just that.1
  2. A measurable and significant reduction in the use of the iPhone. The Watch peels off uses from the iPhone and therefore the more it peels off, the less remains. However, that which remains will be more uniquely valuable to the incumbent. This is the process of carving and erosion that the PC experienced vs. mobile devices in general.
  3. An increase in the mix of large-screen iPhones. As iPhones are removed from pockets more rarely, the larger version might be more comfortable to carry and more useful to use for the immersive tasks that are outside the scope of Watch.
  4. An overall increase in iPhone sales beyond the foreseeable trajectory. This would suggest switchers from Android would be drawn to the platform purely for the value of the “accessory”. Note that this is not inconsistent with the lower usage and higher spec mix measurements.
  5. Apps uniquely targeting the Watch. It’s hard to imagine how this will develop as it involves millions of creative minds, but as smartphones created new economic value through the solving of new jobs to be done, the Watch should do the same. As a side-effect it should lead to new empires (or at least Unicorns) being formed around Watch use.
  6. Iteration. How quickly and deeply will the product be improved? Basic accessories like headphones and Apple TV have a leisurely update cycle. Smarter devices are faster. The cycle time of iteration should indicate how seriously Apple takes the platform and that itself should be fueled by positive consumer sentiment for the product.

These indicators are vague and the data will be weakly signaled but in many ways it will be more meaningful than any financial performance figures.

  1. It leaves open the question as to what watches as currently defined will come to be known as. []

Luxurious

Apple’s new watches are priced in a pattern unlike any of the previous pricing models for Apple products.

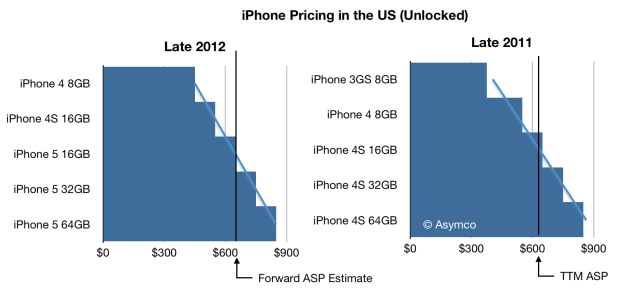
Previous pricing models for iPhone, iPad, Mac and iPod were typically structured around storage differences. The higher the storage, the higher the price. The Mac had a slight variation where processor and graphics offered some additional configuration options. To illustrate, the graph below shows typical price bands for the iPhone (2011 and 2012)

Screen Shot 2015-03-30 at 11.51.16 AMIn contrast, the watches are differentiated by size, materials and bands. There are also a total of 38 watch configurations available at launch (SKUs) and another 38 bands that can be purchased separately.
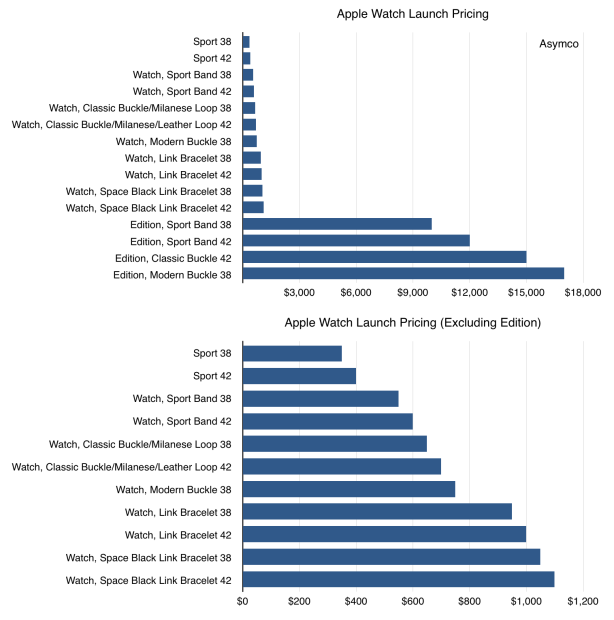
The bands come in four price points and the watches in 15. Of these 15 watch prices, four are dramatically different. The pricing of the watches is shown in the two graphs below (with and without the Edition).

Screen Shot 2015-03-30 at 12.03.19 PM

Continue reading “Luxurious”