As a rule, I don’t like to make a forecast for Apple’s performance during quarters where there is no guidance. There is a good reason why there is no guidance. The management does not feel confident that there is enough information to make a reasonable prediction. Keep in mind that the management has very detailed, very frequent updates on their business metrics.
Anyone who has run a business knows that signals of performance are abundant and one can only imagine how many signals arrive at Apple HQ from the 1.5 billion active devices, tens of thousands of points of sale, and a vast network of resellers. There are also billions of interactions in services. Then there are search queries, store visitor counts (online and physical), developer payments, app downloads, content downloads, subscriptions. All this information is collected and analyzed on (probably) a daily basis.
Also when guidance is given, it’s usually a month into the next quarter. The company will have already seen about a third of the quarter already pass before they predict the next two thirds.
This last quarter in particular was even more difficult given the delays in launching the new iPhones and the dynamics related to the broader portfolio.
And yet, the company feels that they can issue some “insights on our expectations”. Here is what was said about three months ago:
These directional comments assume that COVID-related impacts to our business in November and December are similar to what we’ve seen in October. […] [W]e expect iPhone revenue to grow during the December quarter despite shipping iPhone 12 and 12 Pro 4 weeks into the quarter and iPhone 12 mini and 12 Pro Max 7 weeks into the quarter.
We expect all other products in aggregate to grow double digits, and we also expect services to continue to grow double digits. For gross margin, we expect it to be similar to our most recent quarters despite the costs associated with the launch of several new products. For opex, we expect to be between $10.7 billion and $10.8 billion. We expect OI&E to be around $50 million and the tax rate to be around 16%.
Luca Maestri, Chief Financial Officer
So, given this information and some hints from IDC, Gartner and CIRP and China I’m willing to offer some estimates:
iPhone Revenue: $63.9 billion
Mac Revenue: $9.3 billion
iPad: $7.4 billion
Services: $15.1 billion
Wearables & Home: $12 billion
Net sales: $107.8 billion
Gross margin percent: 37.7%
EPS: $1.48 (Growth: 19%)
Of course, this is very speculative and I don’t have a lot of confidence in it. If anything it may be on the high side.
I don’t expect there to be guidance for the next quarter with a resumption of guidance only after the pandemic has largely subsided (probably Q3 of this year.)
I wrote the initial guide almost exactly six years ago. Also known as “The 10 Commandments of Automotive” it’s time to re-visit it to see how and if anything has changed.
The rules listed are empirical observations. The patterns show how things are and have been and hint at what can and cannot change. Capacity utilization and capital allocation are perhaps the most basic root causes for how the system operates.
Capacity utilization has meant that incumbents needed to produce large quantities even if they were not doing so profitably (1st commandment). The capital invested in plant and equipment had to be amortized. This meant it was difficult to enter with a low volume strategy. Indeed all entrants that succeeded did so with “people’s cars” (2nd commandment) which were destined to mobilize entire nations if not continents.
As production orientation absorbed all attention, innovation in production determined the cycles of dominance. First Ford, then GM, and finally Toyota refined the production system (3rd commandment.) Eventually every producer would adopt the “best practices” but the innovator would have years if not decades of competitive advantage.
The political implications of the automobile became a dominant question as it effectively terraformed its environment. Cities, ancillary industries and even our climate were affected. This meant infrastructure, tax policy, land use policy and financial systems became dependent on automobiles. In return governments began to regulate, creating a symbiosis between government and automakers. (4th commandment).
New technologies were plentiful but they all got absorbed by the industry. Mechanical, chemical and material sciences, computation and communications were all sustaining. (5th commandment.) New fuels, microprocessors, wireless technologies; these immense evolutions did not change the structure of the industry.
As new countries became prosperous they not only adopted cars but they adopted car production. The Europeans were first with the technical invention but the US was first with mass production, followed by Western Europe, Japan, Eastern Europe/USSR, Korea, China and now RoW. (6th) Each new entrant had the advantage of hindsight and would be more efficient, at least for a while.
Low volumes were left to “luxury” brands which survived by solving a different job than transportation, namely that of status signaling. Eventually the low- and high-end merged into brand holding companies. Capacity was traded and cross-ownership, joint ventures and “badge engineering” was widely practiced. Governments kept competition at bay for national champions, mostly. (7th commandment)
Cars grew to over 1.2 billion installed base and, including commercial vehicles, reached 100 million units of production/yr. The problem that arose was that the infrastructure could not keep up. Urbanization was growing faster than motorization and land became scarce. Cars need land. Lots of land. For roads but also for parking (3 spots for every car in use, at least.) As global prosperity increased and as prosperity meant a car the struggle to find room for these modes of transport grew intense. Most users now found the car to be a constraint rather than a liberation. (8th commandment.) Parking and congestion were problems highly evident to the motorist but the externalities of exclusion of public space and emissions became highly evident to the governors who, you remember, are in a symbiotic relationship.
Clearly the pressures were building for drastic improvements in how transportation would be allocated. My response was to promote micromobility, the idea that small is better and smallest is best and that the tendency of the industry to supersize its offering in the face of increasing constraints was classic innovator’s dilemma. Incumbents could respond by rapidly changing their portfolio to include a wider variety of form factors and while they broadened the portfolio (e.g. Audi went from 4 models in the 1960s to 40 in the 2000s) they did not go below a certain line (the 500kg line). They also did not modularize their production system. Production (body-in-white, paint, engine and final assembly) remain in-house while parts are outsourced. (9th commandment) This was peculiar to me and indicated a deeper structural issue.
Instead of a pivot downward, the industry keeps chasing size, mass, volume, power, range. Most trips are short but all the engineering goes toward the long tail of highly improbable distances and loads. (10th) Always the answer to this dilemma is that you build what customers demand. Well, which customers are you asking? Under what circumstances are you framing the question? Well, never mind, let’s build electric versions of the same cars.
These constraints determined the outcomes for the industry for a century and are predicated on decisions allocating limited resources and capital based on we might call classical microeconomics; but all within a bigger political and indeed geo-political context.
So what has changed?
This classical model has one potential flaw: The assumption of capital as a limited resource. An odd thing happened in the last decade. Capital has not only become really cheap, in many cases it has reached a negative cost. This is evident in negative interest rates. When I observed this I thought something fundamental was broken. If there is so much capital that people are paying you to keep it for them then a lot of this “classical microeconomics” begins to break down.
The firms that are husbanding capital can be “disrupted” by those who squander it. Those who observe discipline and pursue efficiency can be defeated by those who are undisciplined and inefficient.
Holy cow!
This entrant’s guide is a rationalization of what governs one of the largest activities we engage in. And yet it may be undermined by an imbalance. The evidence is in the capitalization (and hence free capital availability) to entrants who have little to offer except a dream. The incumbents who thought they could sustain through technology transitions are being out-spent and having their access to what is still limited (raw materials or components) curtailed.
Need more proof? Tesla has single-handedly doubled the value of the automobile industry in a year when overall volumes and sales shrank.
That means that either there will be twice as many cars as we have now or they will be twice as expensive or they will be twice as profitable. And all that will happen really soon. We can’t have twice the cars since there will be nowhere to park them. We can’t double the price unless we double our wealth. We can’t make them twice as profitable unless we disable competitive forces and change the production system.
Or, it could be that half the assets (all the other automakers) are worthless.
Something has to give. The paradoxes multiply.
Into this will, one hopes, step Apple. Things are about to get really interesting. Stay tuned.
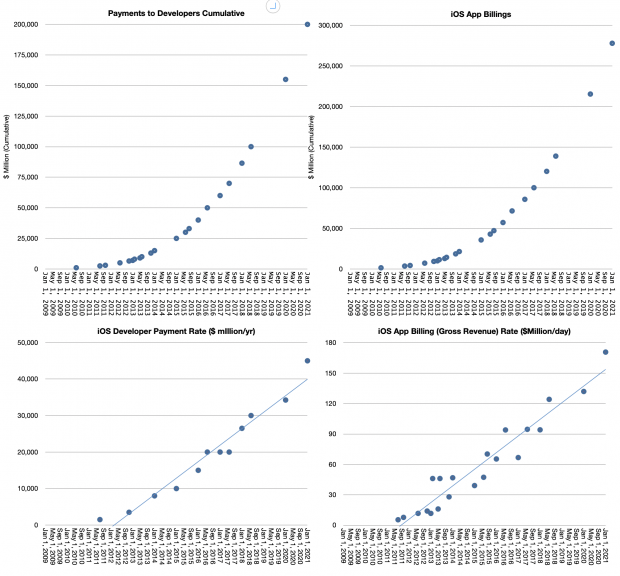
App Store spending was $1.8 billion in the last week of 2020, up from $1.42 billion the previous year —an increase of 27% vs. an increase of 16% from the previous year.
On 1/1/2021 App Store spending reached $540 vs. $386 million for 1/1/2020. This was an increase of 40%. The previous year’s increase was 20%.
Developers selling through the App Store have now earned more than $200 billion since the App Store launched in 2008.
The previous year’s figure was $155 billion, making the 2020 total $45 billion, a 30% increase from $34.5 billion average of the previous two years. Assuming a proportional increase, overall ecosystem transactions rose to $675 billion in 2020. This places Apple’s valuation at a 3.2 multiple of its yearly ecosystem value and each customer is valued at approximately $1400.
The history of App Store revenue and the growth rates involved is shown below.
NB: A substantial amount of App Store revenue is derived through subscriptions which now total about 600 million.
A simple summary is that the App economy accelerated its growth in 2020. This implies an economic value reaching $1 trillion/yr. within two years. It would behoove the investor to evaluate the value of Apple as a multiple of its ecosystem as well as a multiple of its customer base.
As I have repeated over time, the strength and resilience of Apple is in its customer base. Strength in terms of willingness to spend for quality and value and resilience in terms of sustained satisfaction. As that base grows to well over 1 billion people and as this billion are exposed to an increasing spectrum of value options (products, services and ecosystem) the company becomes indispensable.
This is quite the opposite of the perceptions widely held even a few months ago.
In other news:
Apple added 52 new territories to Apple Music.
Apple TV is now available on over 1 billion screens in over 100 countries and regions, providing access to buy or rent over 100,000 new release and classic movies and TV shows
Apple Pay is accepted at more than 90% of stores in the US, 85% of stores in the UK, and 99% of stores in Australia
Apple Books now draws over 90 million monthly active users
Podcasts are now available in over 175 countries with programming in more than 100 languages
More than 85 percent of iCloud users are protected with two-factor authentication
The Apple product line-up for 2023 is almost completely decided. This is not conjecture but simply an observation of the lead times for developing the types of products that Apple offers. The integration of hardware, software and services, often cited as the key to Apple’s sustainable competitive advantage, has a great cost: the time required to develop in an integrated fashion is far longer than the time required to develop in a modular fashion.
2.5 years is not a long time. The development process on truly new products could take 4 to 5 years. Apple Silicon, new Operating Systems and new services could all take longer than 2.5 years. The products we just saw launch this year were planned and engineered at least 2 years ago. The more integrated, the more time is needed. Wearables, AI/ML and process engineering are additional examples of long arcs of development needed to reach products.
This does not mean we can predict what these products will be. We don’t have visibility to the process but Apple management does and they will make decisions now on adjacent dependencies in the business. For example, visible efforts in planning the use of cash, the carbon offsetting, capital expenditures and R&D are all synchronized to the roadmap and hints may be read into this data.
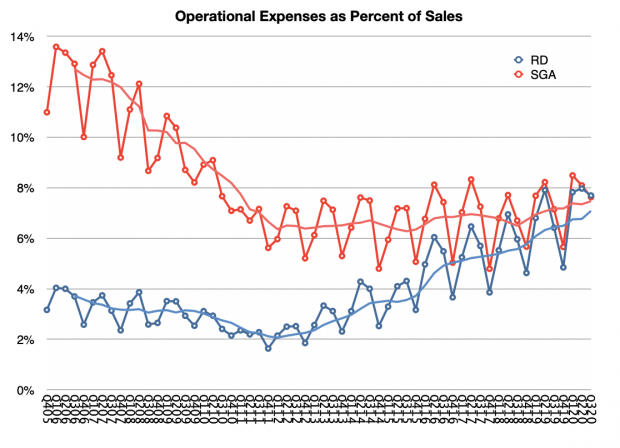
The biggest hints are the R&D spending and the company’s capital return program. Combined they show a confidence in the roadmap that is hard to overestimate. First, R&D is reaching new highs of about 7% of sales (on a trailing 12 months’ basis, see graph below). This is almost the same as the spending on SG&A which has declined as a percent of sales from above 12% pre-iPhone.
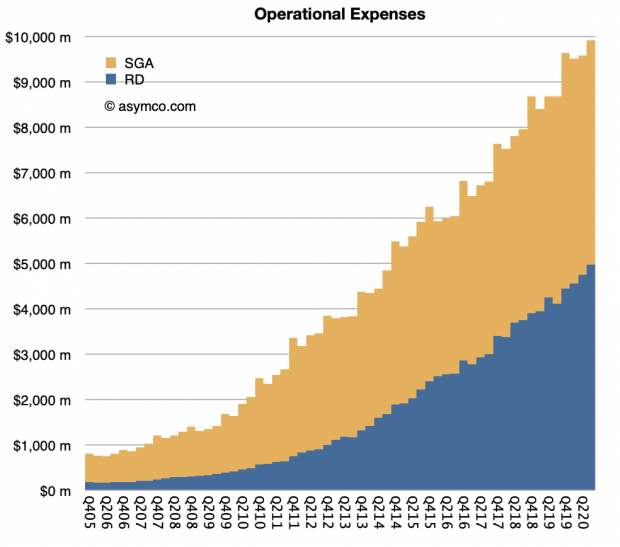
Of course sales have increased significantly over the time shown in the graph below and the absolute spending is shown the following graph. R&D spending is over $5 billion/quarter or about $20 billion/yr. Some of the results of this will be seen in 2023 or beyond.
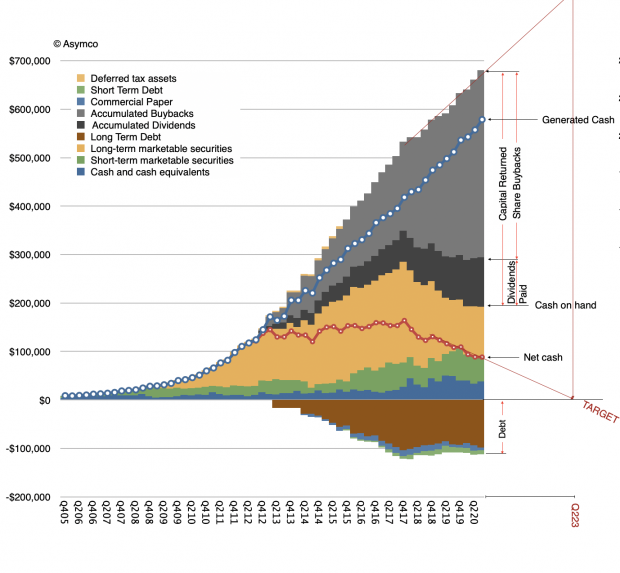
Next, capital returns. The company is returning almost all the cash it generates and is reducing its cash balance. It has returned about half a trillion dollars to date. Dividends paid has reached $100 billion and share buybacks about $400 billion. This is the largest capital return in US history.
The company has declared its intention to reduce net cash to zero. This means it will still have substantial cash due to loans in the form of bonds but no “excess” cash will be held by the company. This is in contrast to the strategy under Steve Jobs where he sought to keep as much cash on hand as possible due to the need to weather potential storms, Tim Cook’s Apple is being very “casual” about cash.
Steve Jobs had his reasons for hoarding cash. The company had been through periods of existential crisis. The absence of cash jeopardized its independence and it was something he vowed never to happen again.
However if that strategy would be maintained to this day, as the graph shows, the company would have cash of nearly $700 billion today. It would make Apple the world’s largest hedge fund, by far. Second only to a very few sovereign funds. Given a conservative cash preservation mandate it also means that that capital would largely go unrewarded because the return on it would have been minimal, negligible. Not to mention also the target it would paint on the company’s balance sheet.
So given the trajectory in net cash being so consistent, it’s probable that the goal of net zero will be reached mid 2023.
That leaves the question of what will happen at that time?
The answer is nothing. Nothing will happen. The capital return programs will probably be ended and additional cash generation will be paid as dividends going forward. That’s it.
Rather than suggesting a change, the capital return program (and the R&D program) suggest a lack of change, consistency. The company management is anticipating a steady capital generation rate, a steady product roadmap (with predictable growth) and a steady customer base (with predictable loyalty).
This future for Apple in 2023 may seem boring. But that’s exactly the plan. This is a plan that the company management has been making for a long time and has been executing for a long time. The plan is to be boring on the business side but exciting on the customer product side.
Consistency has been the characteristic trait of the Tim Cook era. It is a smoothing of seasonality with services. It is the clockwork delivery of product updates, regardless of macro and externalities. It is a growth in user base consistent for a decade.
It is perhaps because more people believe that consistency is the future that we have Apple’s P/E ratio now in-line with its peers. Paradoxically, being boring is what makes Apple shares so exciting today.
We’ve partnered up with Asymco to bring you an exclusive $25 credit for new users. Just sign up through this link.
SaneBox is like a super-smart assistant who’s been with you for years and knows what’s important to you. It moves unimportant emails from the inbox into a new folder and summarizes them in a digest, where you can quickly bulk-process them. An average SaneBox customer saves 12+ hours/month.
Additional features:
SaneBlackHole – Instantly unsubscribe from annoying marketers, mailing lists and newsletters
SaneReminders – Get a reminder if someone doesn’t respond to you
SaneSnooze – Snooze non-urgent emails
…and more features to enhance your existing email setup
With glowing reviews from TechCrunch, Forbes, The New York Times and emailers everywhere, you can rest assured that you will fall in love with email again. And it’s risk free—cancel and your email returns to the way it was.
The term Post-PC was first coined by MIT scientist David D. Clark in 1999 and was quickly adopted by both Microsoft’s and Apple’s former CEOs. Jobs popularized the term “post-PC” in 2007 (the launch of the first iPhone), and in 2011 when he launched iCloud, a service enabling Apple devices to synchronize data through cloud services, freeing them from dependency on a PC.
The Post-PC era was posited during the late 2000s and early 2010s presupposing a decline in the sales of personal computers (PCs) in favor of devices, phones, tablets, wearables, IoT, etc. These devices were mobile first (i.e. battery-first as opposed to plug-first), connected second and cloud-powered third. They were designed to run “apps” not “applications” and had new ecosystems with millions of developers selling through online-only stores, priced often as subscriptions rather than seat licenses.
In the last decade or so, the PC did endure an overall decline in sales while phones, tablets and wearables climbed to at least 10x volumes of the PC. But the last few months have shown a resurgence in PC sales. Certainly the necessity of working from home is the reason but will this last?
The fact is that the PC did not disappear. It certainly is still in use and there are buyers for it. There just isn’t a lot of growth or energy. There hasn’t been for a decade. The software and hardware efforts are uninspiring because the talent has moved elsewhere. The creativity, R&D budget have gone the same way.
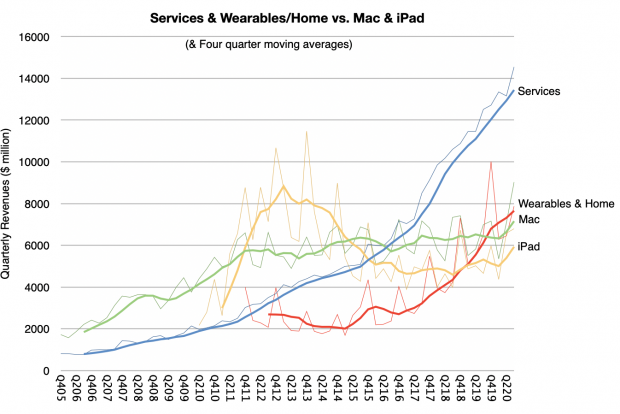
But what about the Mac? The Mac is the PC from the company that more or less defined the Post-PC era. Would it not be the first to be sacrificed for the new future? As it stands, as the graph below shows, the Mac today is double the business it was decade ago and although it has been overtaken by wearables, it has kept ahead (after a time) of the iPad.
The trouble with PCs, including the Mac, is that they are stubborn in how they define themselves. Like the power user, they see performance along certain dimensions. They also don’t see performance along new dimensions which devices offer with glee. For example connectivity to cellular networks (still missing in even the fanciest laptop but available on my watch.) Then there are the sensors which measure my heart rate, activity level, location, altitude, etc. Then there are cameras which on phones now boggle the mind. PC cameras are comical in comparison.
Then there is portability and usability without being plugged in.
Well, it was. With the M1, Apple has finally delivered the always-on feel of a tablet or phone and the more-than-one-day battery life. It also added a lot of neural engine horsepower and a lot of on-chip memory. Apple is delivering a system on a chip which makes the Mac more device-like in its integration. And sales are likely to rise, on the back of a great 2020 for the Mac. The form of the machine might even change with new designs being made possible by the lower heat profile and space savings.
And so I’m writing this post on a Mac. The graph you see above was created on the Mac. It’s possible to do all this my iPad and even on my iPhone but it would be harder. But I’m also willing to bet you’re reading this on a phone.
And that’s the crux of it. The PC is still the machine of choice for authoring while the device is the machine of choice for consuming and consuming will always be more popular. What the iPad has done is taken a share of PC use and in my case I do use it for some tasks like email a lot more frequently. The theory would suggest that the iPad will continue its upward trajectory while the PC would abandon the low end.
This disruption has already happened but it hasn’t been complete. The median performance band now belongs to devices but the professional will always ask for more of the performance which they see as productive while the consumer will always ask for more of the performance which they see as convenience. Here the market bifurcates.
What has been problematic with the smaller of the two markets has been the vicious cycle of lack of investment due to decreasing margins, commoditization and talent flight. What Apple is doing once again is ratcheting up the bar for the PC to make sure it’s the top choice for creative professionals. And as long as they are productive, the consumers will keep them employed if not in riches.
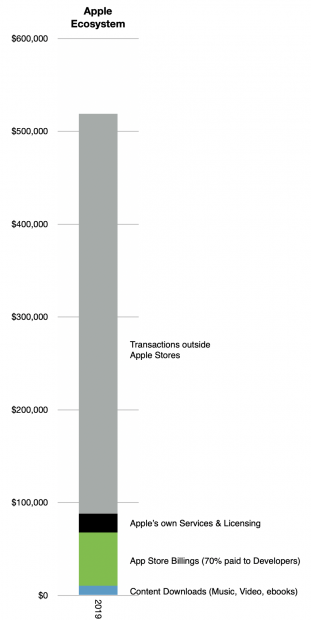
According to one estimate, in 2019 Apple’s ecosystem was approximately $519 billion. This includes both transactions that Apple handles, such as paid apps, as well as purchases and other economic activity that happened through apps in which Apple is not involved in the transaction, such as Uber, Bird or Bond rides.
A fraction ($48 billion or 9.3%) of this total is reported as part of Apple’s financial statements as “Services Revenues”. The rest ($471 billion) is reported on other financial statements, typically businesses which use apps to book sales. These are app revenues are not even accounted as “Payments to Developers” as they are not paid directly to any developer.
The attention to Apple’s terms and conditions with developers only apply to transactions in the area shown in green below. The grey area is all outside the App Stores and attracts no attention.
The attention paid to Apple’s new services including the “+” brands of TV, News, Arcade, Music and now Fitness and the new bundling thereof refers to the area shown in black above.
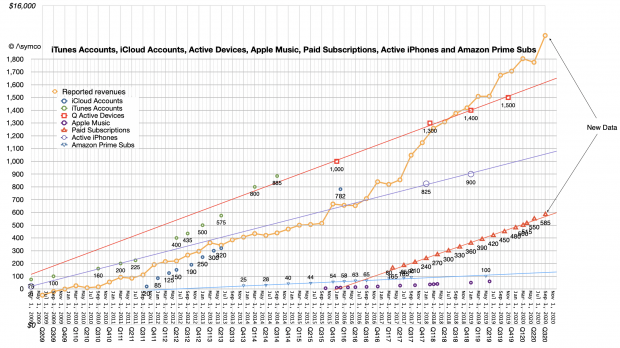
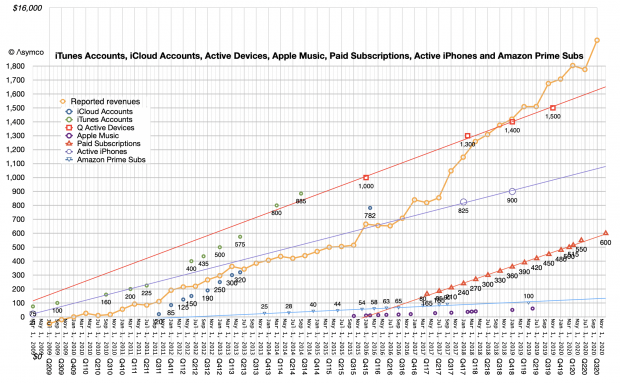
The Green and Black areas are also captured through subscriptions whose quantity is charted with triangles below. Note that the latest quarter saw an acceleration in the accumulation of subscriptions, putting the 600 million target set for end of this year closer than expected. Note also the change in slope of the yellow line as the triangles were added.
These two charts are an attempt to illustrate what is a huge set of activities. Apple’s product lines may be something we can grasp in terms of objects for sale and price points, and feature sets, etc. But the Ecosystem that sits on top of these devices is not comprehensible.
There are literally millions of apps, services, and ways of delivering and capturing value. There are millions of people employed in what amounts to an economy bigger than the 25th largest in the world (Belgium (1)). It’s half a trillion dollars of activity.
Given the growth of the underlying Services segment (~15%), it’s probably going to double in 5 years to $1 trillion. Apple will certainly benefit as even if only 9% of that is booked as direct revenues, the rest will create resilience in the user base.
The power of an ecosystem isn’t what Apple is able to skim from it but rather that millions of other people will want to encourage and preserve its existence as their livelihoods, hopes and aspirations will depend on it. This goes beyond loyalty of end users (which is extraordinary) as it’s a loyalty of those who co-invest in it. All participants in an ecosystem become partners in its preservation.
Apple is not the only technological ecosystem out there, but I’m willing to bet that it’s the most vibrant in terms of creative effort, economic value and growth.
This ecosystem is a thunderous declaration of value which is largely unheard by investors or analysts. While looking at the potential for growing the direct revenue with “+” Apple services, the indirect, qualitative added value of services which never hit Apple’s income statement are ignored. Like the ignored value of a satisfied customer, how much is the value of an economic co-dependency?
Although it’s inappropriate to compare a company’s market capitalization (which is a measure of asset value) with GDP (which is a measure of economic activity) an “economy” like the value of all transactions in an ecosystem is comparable with GDP.
The latest Apple Watch has a blood oxygen sensor which measures the wearer’s oxygen saturation (SpO2). Oxygen saturation is the fraction of oxygen-saturated hemoglobin relative to total hemoglobins in the blood. If the level is below 90% it is considered low and is very dangerous. An alert is issued in that case.
The Watch also monitors (periodically but consistently) the wearer’s heart rate and can warn of abnormal rates. It can also detect patterns of irregular heart rhythms and atrial fibrillation.
The Watch can also provide VO2 max or the maximum rate of oxygen consumption measured during exercise. This measurement provides a quantitative value of endurance fitness and reflects cardiorespiratory fitness.
The Watch can also generate an ECG or electro cardiogram which is a graph of voltage versus time of the electrical activity of the heart using electrodes placed on the skin. The ECG can be generated as a PDF and sent to a physician for analysis.
The Watch also monitors sound levels providing a warning of when the wearer is exposed to dangerous sound levels and should consider protecting their hearing.
The Watch can also detect a fall and summon emergency services even if the wearer is unconscious. It can also be used to summon assistance with a push of a button.
The Watch uses machine learning to track sleep and can monitor the vital signs listed above during that time.
The Watch has an always-on altimeter which is working to help with tracking effort by the wearer.
The Watch can detect hand washing and provide a timer so you do it well enough.
The Watch can track all physical activity and provide motivational reminders to meet daily goals.
The Watch can monitor exercise with precision and provide data that helps you improve your performance.
The Watch can also be used to pay for your groceries at the register.
The reason the Watch can do all these things is because it’s a computer. A computer with a dual core processor based on the A13 bionic chip also used in the iPhone 11, a retina display that is always on(!) and displaying at least 500nits at all times. It has on-board storage for music, WiFi, Bluetooth and a touch screen.
But although being a computer allows the Watch to do all this and more, no PC can do even one of these things. Nor does a PC have GPS, or Cellular connectivity or NFC and is certainly not swimproof. You don’t wear a PC in bed and it does not stay with you 24×7.
The Watch is among a class of devices that have emerged less than five years ago that do many things that PCs can’t. They also do many things phones can’t.
Biometric sensing (SpO2, ECG, Afib detect, sleep tracking, fall detection, etc.) were not features that were even requested from phones or PCs (or tablets.) Nor did PC users ask for iPhone or tablet features like taking selfies, gesture-based gaming and Lidar.
The Watch has taken on the job of health monitor and health preserver. It isn’t a job any other computer would have even attempted.
The story of phones, tablets and wearables is a story of creating new markets, not substituting for old ones. In so doing the new markets are greater than their putative substitutions would allow. This is happening over and over again but it still seems to go largely unnoticed. Keep an eye out for a lot more of this.
The iPad was launched in April 2010, about three years after the iPhone. Followers of the company will know however that the iPad was designed first, starting sometime in the early 2000s.
The iPad was the prototype touch device because it’s less constrained but also because Apple was, at its heart, a computer company and the iPad was a computer first, device second.
Concepts of tablets predated Apple’s entry and go back to the 1990s. The idea of a “Tablet Computer” was envisioned by Alan Kay as the Dynabook as early as 1968. He famously remarked that if Apple were to build a tablet-sized iPhone it would “rule the world“.
But has the iPad come to rule the world?
Ten years is not a long time—the Mac is now 36 and it’s still kicking, Windows is only 25 years old—but already 500 million iPads have been sold.
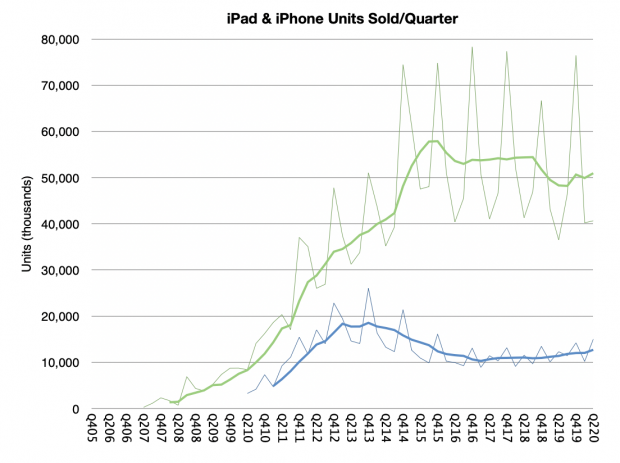
The sales history of the iPad in units is shown below in blue vs. the iPhone in green. (Note, values in last 8 quarters are estimated).
The story that did not pan out for the iPad is that the unit growth did not match that of the iPhone, which, in its first decade sold 1.2 billion units.
But that is because the iPhone and iPad differ in significant ways. Ways which were difficult to anticipate early on.
Difficult because internally the two are basically the same. Both share the same processors and architecture and (until recently) the operating system and user interaction model. They have a similar “bill of materials” (though prices are quite different, with iPhones typically more expensive.)
The main difference has been in the display size. As I noted early on, a few inches of display may not look like a big difference but it is qualitatively very different—as much as a bathtub and a swimming pool both contain water, the quantity of water changes dramatically what you can do with either.
As a result of its size, the iPad is more likely to remain at home; not stationary in one spot, but not “in-hand” at all times. That affects how long it lasts and the tasks it’s assigned to do.
As a result, iPads stay in use longer, get passed on to new users and serve for many years. Their average life span is likely well over 4 years and 9 year old iPads are not uncommon. It’s therefore very likely that the vast majority of all iPads sold are still in use.
So the true measure of success is not units sold but number of active (and satisfied) users. The iPad user base is probably around 400 million (about 27% of total active Apple devices.) The degree of activity is also telling and is reflected in the million apps built specifically for the platform.
400 million users makes for a healthy ecosystem, especially as the users tend to be willing to spend on apps and services, which in turn, attracts more investment from developers, which leads to more usage, and so on, in a virtuous cycle.
As with all aspects of Apple analysis, the qualitative is just as important as the quantitative, even more so. The quality of the users, the usage and the product is the pre-eminent assessment.
iPad users, usage and product make for a remarkable combination. On the product side, the Fall 2020 line-up is another leap forward. In particular, the price points, breadth of offering, accessories (mini, Air, Pro, pencil, Smart Keyboard, etc.) and the power across the board.
This year sees a performance jump in the middle of the line-up with the usual mind-boggling measurements (some beginning with “nano,” and others with “tera”.)
So where to for iPad now? What worlds remain for it to conquer? So far has found users in the three “E”s: Enterprise, Education and Entertainment. Pro usage is a niche that is growing in production, especially media. What many might say is that it needs to aim at replacing the laptop, or the PC in general.
It has not done that so far, much to the delight of naysayers. But this is not as big a failure as it might seem.
First note that the Mac user base itself is not nearly as big (110 million +/-10%). iPad could be 4x bigger in user base. The Windows base is larger at 1.2 to 1.4 billion but that resists frontal assault as it is deeply entrenched around enterprise workflows. It’s also bereft of profit.
What iPad did do is create its own demand. It sits comfortably aside other platforms not in place of them. Most iPad users also have an iPhone and a PC or a Mac. I happen to have all those and more than one iPad. The iPad did something grander than kick the PC off its perch. It sat next to it and found life quite comfortable.
In March 2016 Ben Bajarin and I put on an event called SUBSCRIBE where we asked, among other things,
How will the online services business models evolve?
How will hardware affect software and services and vice versa?
How will users, usage, and capital connect?
Now is a good time to look back on that event.
For the keynote I prepared a model which predicted the mobile ecosystems for iOS, Android and Chinese Android over the next 5 years (to 2020). The methodology involved taking a measurement of the revenues of the top internet service companies, building up the categories these companies occupied, estimating how much of those revenues are through mobile distribution and then splitting the result among the three platforms of iOS and the two Androids.
Adding to that the “native” app and content revenues for each platform would yield the Ecosystem total value. Applying a growth rate would offer some visibility into the future.
The following images are screen captures of the Perspective presentation.
Of course there are several potential errors in this methodology. The categories were not all inclusive. I used Social, Media, Search, Maps, email, Messaging, e-commerce, Travel, Enterprise, Storage, Transportation, Travel and Other as the top level categories. There are many products and services who would end up in Other. Moreover, these categories were anchored by the top companies in each category and the share of the top names was not always clear. Finally, the growth rates for these categories were based on historic trends which could change either way.
The online services ecosystem (all platforms) was thus estimated to be $450 billion in 2015, growing to $820 billion by 2019 and $914 billion by 2020.
The mobile split would vary by segment but would be roughly 75% by 2020 (25% would not be mobile). The final assumption was based on the split among the existing mobile platforms. I put a multiple of roughly 50% for iOS and 35% for Google Android and the rest for China Android.
Multiplying all these assumptions gave me a figure of $275 billion for the iOS portion of the global online services market in 2019. (Incidentally, Android was estimated at $207 billion and China Android $110 billion.) Note that this does not mean this was an expectation of Apple’s revenues or that this was the opportunity of Apple obtaining any percentage of this revenue. It was simply the value of what would transact through iOS, a platform which would act as a commerce enabler. This was to be the size of the iOS “ecosystem” or co-dependency between Apple and the companies delivering through its platform.
Ecosystems are a powerful idea. As I recall, this term applied to mobile was coined by a Palm executive in the late 1990s when he referred to the value of all the apps built for the Palm Pilot. The biological term refers to the system of multiple species living in close proximity. It implies an equilibrium as each species benefits from the others and the environment. There might be predators and prey but biodiversity is the successful construct.
The idea of an ecosystem for a platform was also the core strength of Microsoft’s Windows which created the network effects around it and it has been the goal of every platform since. The nature of computing and networking implies that these systems grow faster and are more resilient than the more traditional value networks of other businesses or industries.
Now this ecosystem was something we wished to highlight in 2016 as a core strength for Apple. It was not considered as such at the time and I thought putting a figure of $275 billion in 4 years’ time was a way to highlight the potential. Time since has proven us right.
This week Apple highlighted the result of another research team who attempted to measure the iOS ecosystem. Their conclusion was that billings and sales facilitated by the Apple App Store Ecosystem in 2019 was $519 billion. More than twice the amount I had so optimistically forecast four years earlier.
The authors also emphasize that this is a conservative estimate and should serve as a baseline.
I feel partly vindicated about that figure as my attempt at a figure was intended to highlight the scope of the ecosystem and it is better to have underestimated it than overestimated it. The authors’ methodology was also similar in being bottom-up summation of components by categories of services but the information available today is enhanced by the new data Apple made available on subs and Services revenues and install base.
Note that in the graph below the salient data points of subscribers (red triangles) had not begun until 2017 causing the acceleration in Services revenue (yellow line). Note also the additional square points representing install base.
This figure of more than half a trillion dollars of value transacted through iOS should give some pause. It it a very powerful figure that can be combined with the other data from Apple:
More than 1.5 billion active devices
More than 1 billion iPhone users
More than 500 million paid subscriptions
More than $1/day iPhone hardware revenues for Apple
The half-trillion per year on services implies between $335 and $520 in spending per user (likely closer to $500) per year. This would be in addition to the approximately $365/yr in hardware spending per user (which Apple books as hardware revenue). In the case of the iPhone there is yet more: the cellular network service which may average $350 per year.
To simplify, the “average Apple user” spends $1/day for each device, $1/day for the network and $1.4/day on items bought through the device. Adding a margin of error, that’s between $3.4 and $4 per day each user spends. Oh, and there are about a billion such users.
The total spending enabled by iOS thus is close to $1.4 trillion/yr.
That’s a significant amount. It’s bigger than many industries. There are only about 12 countries with higher GDP (Spain is about the same.)
How does Apple benefit from this?
Apple captures 30% of billings through its App Store. My estimate for these billings were $67.9 billion in 2019 which means App Store billings were 13% of the 2019 ecosystem. Apple’s 30% cut of Billings amounts to 3.8% for the whole ecosystem. It’s hardly an oppressive number.
If Apple only captures 3.8% what use is this to Apple?
The last decade has seen Apple emerge as the world’s largest company in terms of market capitalization, and not doing so with a wild multiple of revenue or earnings, quite the opposite. It did this by creating the world’s greatest customer base. Not in absolute scale. Android and Facebook have larger customer bases with multiple billions of users.
No, Apple’s one billion users are simply the best billion users. They are the most likely to stick with Apple and they are the most likely to buy more from Apple and—this is crucial—they are the most likely to buy everything else. Those other companies whose sales come from Apple customers have been taking note. They know that Apple customers are desirable customers and choose to target Apple customers, as much as they can. Associating your company with Apple makes a lot of economic sense.
I will admit however that my argument that Apple created a customer base is contrived. The fact is that Apple creates productsand services and those products are the root of its power to attract the right customers. By choosing to create the best products it coincidentally chooses to create the best customers. The power flows from product not from pricing or positioning. This is a lesson lost for many.
Developers and regulators might feel Apple’s massive power is perhaps too much. In the last decade, the narration around Apple has shifted from Apple being perpetually “doomed” to it being too dominant. Although I’m sure there are some who will try to conflate the two declaring that dominance will inevitably result in doom, most critics of Apple went from laughing (at it) to crying (about its practices).
The argument that Apple should change its practices developed to price as it does, distribute as it does or design as it does because it was too successful or is “unfair” is getting the causality wrong. Dominance won’t be altered by a few points of percentage change (on a tiny fraction of ecosystem transactions). Fairness won’t be altered when there are thousands of business models and many remain to be invented. Case in point is pornography which is not permitted on the App Store but which exists in abundance thorough other access methods.
The argument is that Apple should be more generous. That it should decrease the “cut” it takes for distribution. Or that it should not enforce revenue split for the customers it exposes to others.
But this is problematic on many levels. The playing field for all developers needs to be level. The customer must be respected and access to that customer should be constrained or certainly metered. Abuses must be policed and that requires leverage.
These practices are inter-dependent and the effect multiplicative, not additive. Apple has a monopoly on iOS and on MacOS and WatchOS and iPadOS. It does this to control the experience, security and safety of the user. It’s that control which created the customer in the first place. It should naturally control access to its hard-earned customers.
It does not monetize the distribution of content or apps unless the developer/creator directly charges for the product or service. Distribution is not cost free and to offer it for free is a subsidy which would create additional market and innovation disincentives. The loyalty of Apple users is evidenced by the 600 million paid subscriptions (end of year estimate) that are booked through the App Store. Developers benefit directly as a result.
One could argue that the abundance of services which don’t distribute through the App Store is evidence that the system works as intended. Apple’s App store front is its property and it reflects its core values.
Being on the shelf in the App Store means you operate on the terms of the shelf owner. If the rules are not agreeable then the half trillion dollars of ecosystem activity is testament to the availability of alternatives.