iOS vs. Android: the tale as told by Wall Street

Yesterday I wrote about the growth in Android vs. iOS. The two platforms’ can be said to be enjoying healthy growth, though in markedly different patterns.

The consequences of this growth are being felt across the telecom and computing industries. There are almost 300 million platform devices in use today that were not even dreamed of three years ago. Operators are transporting petabytes more data and dozens of phone vendors are scrambling to meet demand. There are tens of billions of app downloads and hundreds of thousands of apps being sold by tens of thousands of new app publishers. There is a lot of hay being made while the sun shines.

But what about the poor saps that are funding the development? What about the shareholders of the companies behind these platforms. Are they being rewarded or punished?

The following charts tell the story: Continue reading “iOS vs. Android: the tale as told by Wall Street”

The Android step function

There is precious little data on Android units sold. There are estimates but no actual summary. Google themselves don’t seem to know as they don’t report sales, preferring to report “activations.”

Assuming that activations means “unique activations of new devices” then we can draw some equivalency between Google’s reports and the reported units of iOS sold. There is some uncertainty with respect to iPod touch units, but that is not very big (estimates are drawn from Apple’s reporting of overall iOS units at several points in time.)

To estimate Android, I took the download rates currently available and placed them in the month when they were published. I then interpolated the data monthly and quarterly.

To make the comparison more valuable, I chose to index the starting point at the launch of each respective platform and plot quarterly units (or activations). This way we can observe how the platforms ramped in growth and where they were at similar points in their lifetimes.

The following graph results. Continue reading “The Android step function”

Revisiting Estimates for Apple’s second quarter earnings (ended March)

Estimates for Apple’s second quarter earnings ending March | asymco.

Since making the original estimates In January,

  • Revenue: $24.5 billion
  • EPS: 5.89
  • iPhone unit sales: 18.4m
  • iPod unit sales: 10m
  • Mac unit sales: 3.6m
  • iPad unit sales: 7.3m
  • Gross margin percentage: 38.8%

I revised them at the end of March to the following:

  • Revenue: $25 billion
  • EPS: 6.21
  • iPhone unit sales: 17.5m
  • iPod unit sales: 10m
  • Mac unit sales: 3.6m
  • iPad unit sales: 7.3m
  • Gross margin percentage: 39.6%

In the past I was comfortable keeping untouched estimates made three months in advance. This quarter however there have been several developments during the quarter which were unforeseen and cause me to revisit my estimates. Continue reading “Revisiting Estimates for Apple’s second quarter earnings (ended March)”

First quarter PC forecast: Windows down 2%, Mac+iPad up 250%

Charles Arthur of The Guardian writes that PC sales “may have passed their peak“.  That’s a powerful, concise statement. It’s backed up by a quote from Gartner’s Mikako Kitagawa:

“This was the third consecutive quarter of mobile PC shipment declines in the US”

IDC even lays part of the blame to something called “media tablets”[1]:

“While it’s tempting to blame [PC] decline completely on the growth of media tablets we believe other factors […] played equally significant roles.”

But there are several problems with both IDC and Gartner’s analysis of the market. It’s hard to make out causality from their data. There is separation by vendor but not by operating system and there is exclusion of devices hired to do the same jobs as PCs.

For this reason, I need to do my own analysis. I retrieved Gartner’s public statements on the overall market and layered actual Mac and iPad units sold. I also added my estimates for the Q1 2011 quarter just ended to complete the picture.

We can now get an understanding of how the industry behaves with and without various platforms. The chart at the left gives the various growth rates of the market with platforms isolated from each other. I apologize for the shape of the chart but the scale does not permit a concise visual.

Including the iPad, the total PC growth is shown by the blue line. It shows that the market peaked during the recovery but is now slowing considerably.

The green line shows the PC industry excluding both the Mac and the iPad. Although it might include Linux or computers sold without an OS, the label “Windows PC” is a fairly close approximation. It shows that the market excluding Apple entered contraction this quarter and is out of sync with overall economic recovery and growth.

The red line shows the behavior of the Mac franchise. It’s well ahead of the overall market with 2x to 3x the growth. This has been a pattern for over 18 quarters.  I had some thoughts on this in a November 2010 hypothesis.

But the most telling line is the orange line which includes both the Mac and the iPad. In an industry where growth is usually measured in single digits, the iPad business brings growth in three digits.

This near tripling of unit sales is symptomatic of fundamental change that cannot be ignored. Although some analysts contend that the iPad is not causal to the decline in other PC sales, teasing out platforms data seems to show a divergent view.

The bottom line is that Windows-only computer units are down 2.0% while OSX-based computer units are up 272% (this excludes both the iPhone and iPod touch).

Correlation is not causation but tests or surveys where substitution can be proven do exist. For example, a recent survey shows that 77% of users reported that their PC usage decreased after getting a tablet. It also showed that 28% considered their iPad as their primary computer.

So coupling the sales data with the usage data does point an accusatory finger for the decline on the iPad.

In addition, some vendors are being hit harder than others which also hints at where substitution is happening. For example, IDC reports that Acer US unit shipments fell 42% in the first quarter and 16% globally (Gartner’s numbers are less dramatic but in the same direction). Since Acer is known for its netbook computers it’s another telling sign of possible substitution (Acer’s own management has indicated as much.)

So the weight of evidence is beginning to be conclusive: the iPad is the new PC. It should be clear by now that the iPad moves computing into new contexts so it does not yet substitute the PC market but extends it and increases consumption. Substitution is happening in low-end grazing type of usage, a place where the PC was ill-fitting anyway. Incumbent vendors might actually be relieved that the lower margin netbook is finally being supplanted and they can concentrate on the higher end.

Notes:

  1. Analysts like to call the iPad a “media tablet” but the same AdMob survey shows media consumption to be one of its least popular uses.

Mobile device OS upgrades: How hard can it be?

Until the iPhone’s arrival in 2007, upgrading the software on a mobile phone was a rare experience for users. So rare that effectively it was not done. Few people were bothered though since they did not see the product they used as a software product.

This was even true for Windows Mobile and Symbian which were licensed platforms. Microsoft tried several times to offer upgrade paths, but more often than not the device vendors did not push out updates or the process required to perform an upgrade made it the reserve of either those who were paid to do it or those who enjoyed the challenge.

In the era of the modern smartphone, upgrades are more common. Certainly with the iPhone the process is easy enough that opting out of an upgrade is more challenging than opting in. But it’s still not as common with other platforms. Even with all the resources and experience behind them, Microsoft is still stumbling with Windows Phone upgrading.

UPDATE 1-Microsoft explains phone software update delay | Reuters

But is it really a matter of blundering or is there evidence of nominal partners working at cross-purposes?

Continue reading “Mobile device OS upgrades: How hard can it be?”

Pattern recognition for smartphone investors

I spent the last few days in Hong Kong at a conference discussing the smartphone industry. The participants were mainly investors or investment managers. One of the most frequently asked questions was how to spot investable trends in this notoriously unpredictable sector.

The data I presented did not offer much of an answer. If anything, it showed just how much the industry has changed and how unlikely it is to remain a facsimile of what it is today.

But theory allows us to still make some bold claims. Grounding your investment thesis in pattern recognition rather than extrapolation should be the better strategy. So here are the telltale signs I recommend watching for investable ideas. Continue reading “Pattern recognition for smartphone investors”

HTC and self-determination

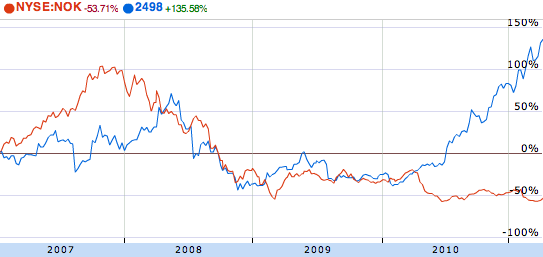
HTC’s market cap has just overtaken Nokia’s. While market capitalization is a fickle thing, shifting with sentiment, this is still a remarkable feat. Nokia’s market capitalization has almost halved in the space of a year while HTC has more than tripled from $10 billion to over $33 billion.

If you roll back to 2007 and the start of the modern era of smartphones, you can see how the two companies stocks traded places:

(source: Google finance)

Continue reading “HTC and self-determination”

Divinely inspired analysis

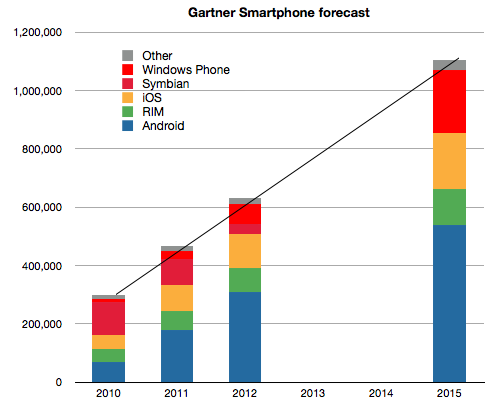
Three things stand out from Gartner’s latest smartphones forecast:

  1. They published a four year forecast with seven significant digits of precision (implying a margin of error of 0.00001%).
  2. There is a linear growth in total market size.
  3. There are no significant share changes after 2012.

The latter two claims are illustrated below:

Continue reading “Divinely inspired analysis”

Expert system

Since starting this blog, I’ve receives several requests for career advice. I am most heartened and humbled by these requests, especially when they come from young people just starting out. I’ve responded as best I can and tried to offer specific advice, but it’s very hard to be specific when the task is so grand.

But here are some pieces of advice that I can offer, which although not specific, may be interpreted into something useful.

Continue reading “Expert system”

When will smartphones become phones?

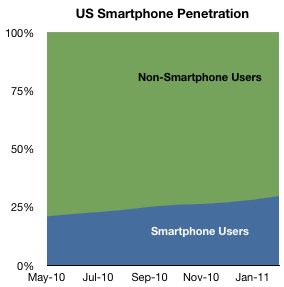
The US smartphone penetration continues to accelerate.

ComScore has been reporting the estimated absolute number of  smartphone users and the last month saw a significant increase of 1.58% in penetration. About 30% of the 234 million US cellphone users (above age of 13) use smartphones. That number was 21% in May of last year.


That means that over 20 million people stopped using voice-only or feature phones in the last 10 months. Equivalent to a rate of 2 million per month.

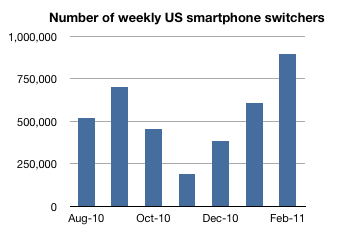
However, the rate of switching has not been steady. The following chart shows the number of switchers per week. In February it’s been about 900,000 per week and it’s quite possible that in March we’ve seen 1 million per week.

To bring the point home, I have put together a countdown timer which will be updated monthly with my estimate of the date when 50% of US cell phone subscribers will be using smartphones. (There is a link to the timer at the top right of every page on this blog).

I pinned that 50% figure because by then I hope people will stop calling them smartphones and begin calling them phones.

Asymco

Asymmetric Competition

Skip to content ↓