Apple Business Review: Cash Growth

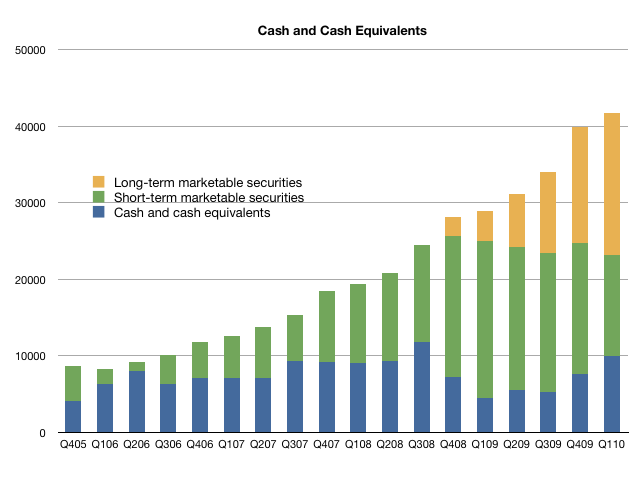
Apple’s cash continues to grow.  This quarter it reached $41.7 billion, a sequential increase of $1.9 billion.  This time last year, the cash was about $29 billion with a y/y increase of nearly $13 billion.  This is equivalent to $45.19 per share.

Many financial sites  report this figure incorrectly (e.g Yahoo finance with $24.8 billion) and are often cited by journalists.  This error is because Apple holds much of its cash in “Long-term marketable securities” and some choose to report only “short-term” holdings as cash.  Apple’s “Long-term” securities are the same as their “short-term” securities, namely US Treasury bonds.  The distinction is in the maturation date, not their liquidity.  Apple makes a clear statement of their cash position every quarter and highlights the composition of their holdings.

Note that more than one third of cash is currently in Long-term securities and exclusion of that item would indicate a decrease in Apple’s cash.

Note also that cash grows in a seasonal pattern. Q1 is typically the lowest growth, and Q4 the fastest.

The graph below shows Apple’s cash by security.
Apple Business Review: Product Line Margins

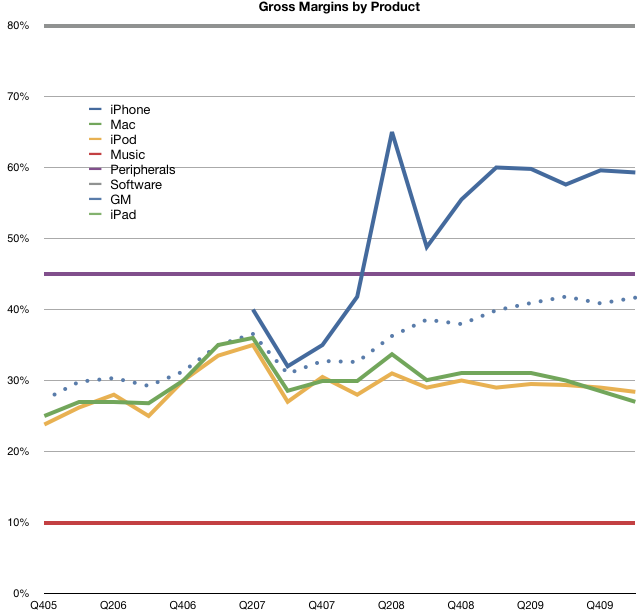
Apple’s overall gross margin reached 41.67%, the second highest ever.  The highest was 41.82% last Fall.  This should not come as a surprise as the iPhone continues to make up an increasingly larger percent of Apple’s total sales.  The gross margin on the iPhone continues to be well above all its other product lines (except for software).

Although Apple does not provide product line GM break-out, some intelligent guessing can be made.  Here are my estimates:

  • iPhone 59%
  • Mac 27%
  • iPod 28%
  • iTunes 10%
  • Periph 45%
  • Software 80%

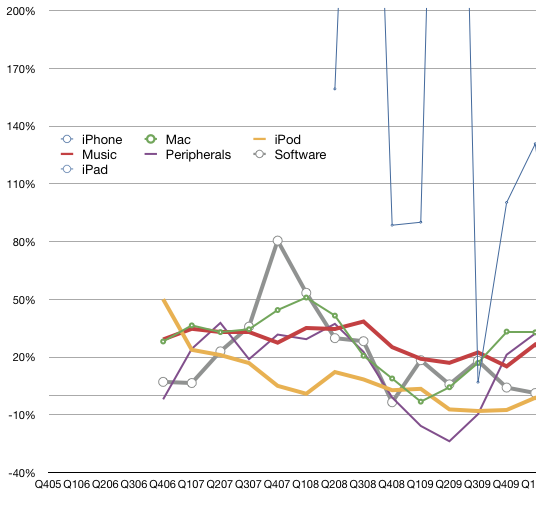
A historic perspective for gross growth (iTunes, Peripheral and Software sales growth) is shown in the graph below.

Apple Business Review: Product Line Growth

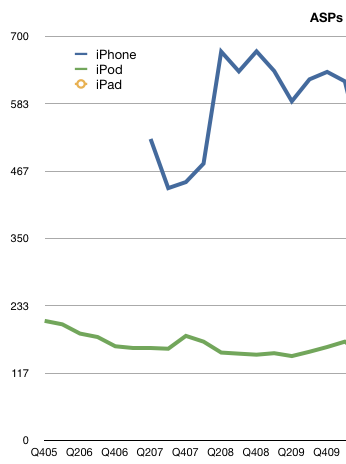
Each of Apple’s individual business lines is profitable.  Last quarter only the iPod experienced negative year-on-year unit growth but still generated a positive sales growth due to higher ASP.

Here is the list of each product line and its y/y sales growth:

Unit Growth, Sales Growth

  • iPhone 131%, 124%
  • Mac 33%, 27%
  • iPod -1%, 12%
  • iTunes n/a, 27%
  • Periph n/a, 32%
  • Software n/a, 1%

Overall sales grew 49%.

A historic perspective for unit growth (iTunes, Peripheral and Software sales growth) is shown in the graph below.

Nokia vs. Apple phones business comparison shows comfortable lead for Apple

Nokia reported 21.5 million converged devices sold in Q1.  The units, share, ASP, Revenues and Operating Profits are compared in the following table.

It’s once again evident that Apple captured more profits from the iPhone than Nokia did from all its devices and services operations.

With respect to converged devices, Apple also generated more sales and had nearly triple the ASP.  Unit shares remained almost the same sequentially. Nokia did suffer more from ASP erosion sequentially as the converged ASP dropped by 24% vs. a 2.5% drop for Apple.

What is interesting from a growth perspective is that Apple’s #1 position in the share of profits from mobile phones was acquired with such a low market share.  Analyst Brian Marshall said the most interesting part of Apple’s story is the international growth of the iPhone. He believes that Apple has only acquired about 1.5 percent of its international carrier partners’ total postpaid subscription base of 525 million. For comparison, its penetration in the U.S. peaked in Sept. 2009 on AT&T with 5 percent.

Sources:

Nokia – Investors- News Release

Apple – Investor Relations

Apple continues to trade at a discount to growth

Apple’s latest earnings showed growth of nearly 90% (following a nearly 50% growth the previous quarter.)

Normally, growth like this is rewarded with a significant P/E ratio of 30 to 40.  Apple enjoyed P/E of 50 as recently as 2007.  However Apple’s P/E ratio dropped to about 22 after earnings.

Although higher than during the worst of the recession, this low P/E either reflects continuing pessimism in the overall sustainability of the economy or a continuing discounting of Apple’s potential growth.

Excluding the nearly $45/share cash and looking at a forward twelve months earnings of 15, the forward P/E is an almost embarrassing 14.

It’s possible that after a few quarters of above 50% growth Apple’s P/E and hence its valuation will return to more normal (PEG ~1.0) levels.  A P/E of 30 at today’s trailing 12 months earnings would put the stock above $350/share.

Non-US iPhone sales approaching 70% of volumes

[AT&T] activated 2.7 million iPhones during the quarter…Apple [announced] yesterday that it had sold 8.75 million iPhones overall during the quarter

via AT&T Activates 2.7 Million iPhones in Q1 2010 as Growth Slows – Mac Rumors.

About 31% of the units sold in Q1 were activated on the AT&T network.  The iPhone is reaching a more balanced global distribution but still has a long way to go.

Pro analysts 51% worse than amateurs in predicting Apple's financials

via Deagol’s AAPL Model: Apple beats up everyone.

Average errors:

11.6%  Professionals

7.7%  Amateurs

—–  —————————————

51.4%  Pros error increase % on amateurs

Note: Apple beat every estimate from every analyst, amateur or professional.  More when we do the numbers.

Tim Cook "shocked" by initial demand for the iPad

On the company’s earnings call, Apple COO Tim Cook says the company is “shocked” by initial demand for the iPad. He also added, “I’m personally addicted to mine and couldn’t live without it.”

via Apple Blows Out Earnings Thanks To Huge iPhone Sales – Yahoo! Finance.

Speaking of iPad, the iPad is almost impossible to obtain in Boston area.  By reservation only.

Asymco

Asymmetric Competition

Skip to content ↓