The Innovator’s Stopwatch. Part 2

The adoption curve has been used to categorize adopters into groups by their behavior: innovators, early adopters, early majority, late majority and laggards. This categorization asserts that adoption is function of psychology, or the likelihood of people to act or react within social systems. [Rogers first edition 1962]

It’s a compelling model and has been proposed as a tool for firms to help with their marketing strategy. As diffusion proceeds through each adopter category, the product is re-positioned to address each group’s presumed behavior. Innovators (first 2.5% of the population) are offered novelty, a chance to experiment and uniqueness of experience; early adopters are offered a chance to create or enhance their position of social leadership; the early majority build imitate the leadership of the early adopters and justify it with productivity gains; the late majority are skeptics but, given a set of specific benefits, join the earlier adopters. Finally the laggards reluctantly agree to adopt as their preferred alternative of not adopting disappears.

The theory suggests that a firm can be successful if they modify their marketing and perhaps product mix to accommodate these adopter categories in a timely manner.

If this is the case however, why is it that those who have access to these data (i.e. who is buying and when) not to do the right thing? Why is it that during a technology adoption curve, there is a high degree of turnover in the firms which capture profits from the products that deliver this technology?

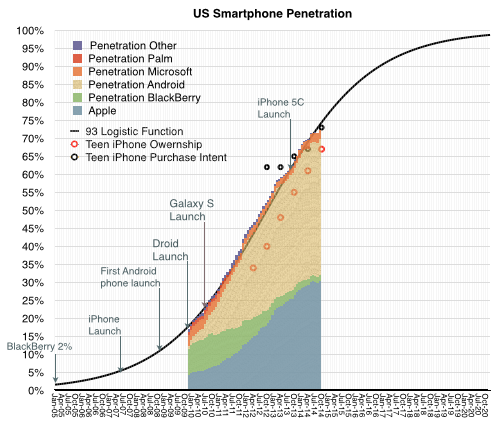
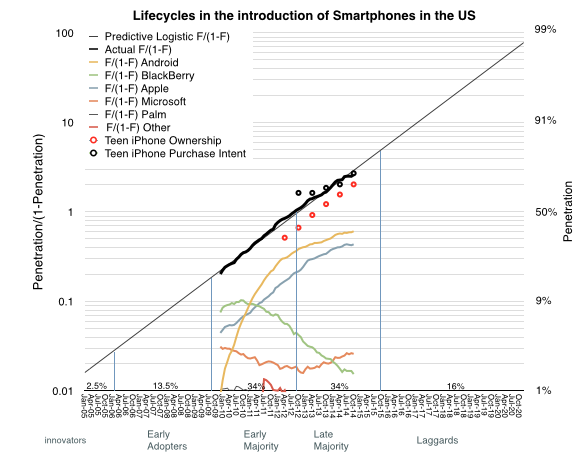
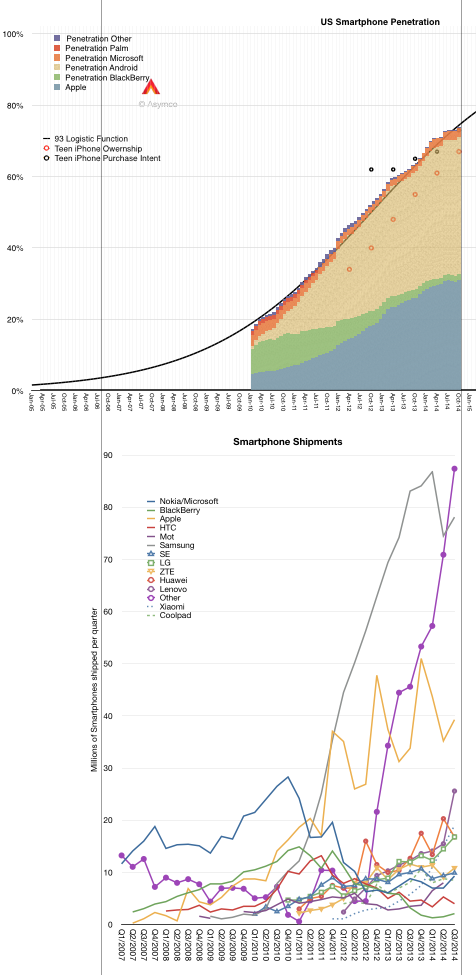
If you don’t believe this to be the case, consider the smartphone market. The data about buyers is easily obtained (even without paying a fee). Shown below is the US smartphone penetration data as obtained by comScore (including teenage survey data from Piper Jaffray).

Screen Shot 2014-12-16 at 5.07.41 PM

Following the penetration data there is a second graph showing the smartphone shipments for the largest vendors as well as the sum of the “others” which make up the difference with the total market. I used vertical registration lines to align the different data sets to the same time scale.

Continue reading “The Innovator’s Stopwatch. Part 2”

The Innovator’s Stopwatch. Part 1

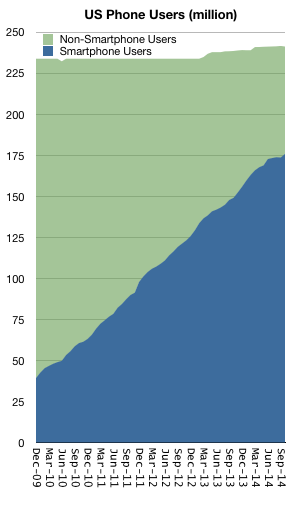
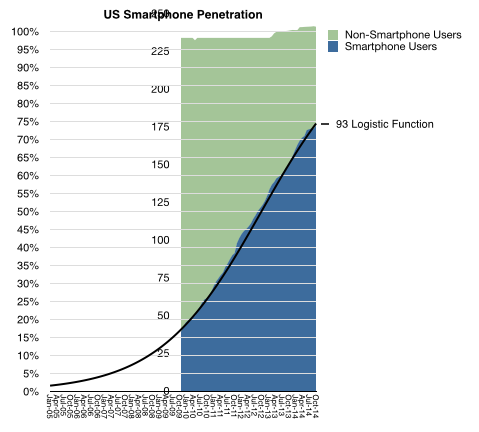
At the end of October 2014 about 73% of US mobile users owned a smartphone. In March of 2005 2% of US mobile users owned a smartphone  (comScore). In absolute terms the number of users increased from about 4 million to 176 million and these 172 million new users were added in less than one decade.

Remarkable as that may be, what is even more exciting is that the pattern of adoption is predictable. The following graph charts the adoption of this product category with a monthly resolution between January 2010 and October 2014.

Screen Shot 2014-12-10 at 2.12.21 PM

Knowing the datum for March 2005 allows us to fill-in the graph with a logistic function approximation for the period to date.

Screen Shot 2014-12-10 at 2.13.46 PM

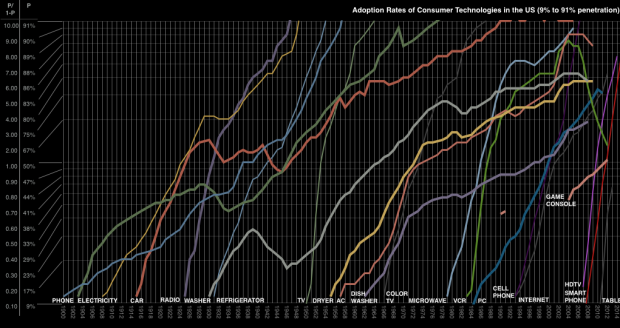
The logistic function is a wonderful model for how technologies are adopted. It’s been evident in samples take for dozens of diffusions, from 18th century canal construction, 19th century railroads, 20th century consumer products as well as industrial and agricultural innovations and the internet itself.

Screen Shot 2014-12-10 at 2.15.00 PM

The reason the logistic curve is so commonly observed is because of its reflection of sociological behavior. When a technology serves a manifest need (or can be hired for a distinct, unmet job to be done) its universal adoption is a certainty. The only unknown is the rate at which this happens. As the graphs above show, some technologies are rapid (examples) and some are slow. Some could be constrained by the communication of its benefits or by the presence of regulation or by the unavailability of infrastructure or resources or financing. Conversely, some could be accelerated by conformability with existing infrastructure or by network effects resulting from communication between adopters. The balance between accelerants to adopting and the constraints on adoption yields the “slope” in the logistic curve.

So given a high degree of confidence in the model, we can forecast how smartphones will be adopted. This model yields further details such as when the various classes of adopter (Early/late/laggard) will join and perhaps that itself will allow managers to plan their marketing and product development.

It would seem therefore that this tool is the answer to building a successful and sustainable enterprise. It would seem that the early movers would have an advantage as their users create the virtuous cycle of learning which the firm will use to capture later adopters. It would seem that firms can effect strategy changes to adopt to each wave of users added to the user base.

It would seem but it has not proven to be the case. For most technology categories, the predictability of adoption has not aided or informed success for firms competing to supply the burgeoning market. If we look at the firms which supply the smartphone market in the US (with platforms as proxies) we see how much turnover has occurred. All the early movers are highly disadvantaged and even some of the later entrants are not assured of viability into the later stages of the market.

Screen Shot 2014-12-10 at 2.17.18 PM

Screen Shot 2014-12-10 at 2.18.24 PM

It’s a something of a paradox that as a technology takes root we might be able to predict how it gets bought but not who will sell it.

This paradox is at the root of the volatility in asset pricing around technology firms. The question investors typically sweat is not whether a company is in the right market, but whether it’s in the right time.


The Critical Path #134: Chief Jobs Officer

Turning our focus back to “Jobs to be Done” theory, we look at how producers can exceed the expectations of consumers and the role of the focus group from a “Jobs to be Done” perspective.

We examine “Jobs to be Done” as an essential core of the product development process. Where does this kind of thinking belong in an organization?

Should we be redefining what being “the best” means? We close with a segmentation of social media services based on the seven deadly sins.

via 5by5 | The Critical Path #134: Chief Jobs Officer.

This is a good one.

Airshow 12 coming to Boston December 18th

Airshow, now in it’s twelfth iteration, is coming back to Boston on the 18th.

This time we have Fidelity Investments as a sponsor and their inspiring venue at ThinkSpace, 245 Summer Street, as our setting.

If you are interested in how data and mobility will revolutionize the art of persuasion, please register for what will be the best Airshow ever.

Seating is limited.

Retail in 2020

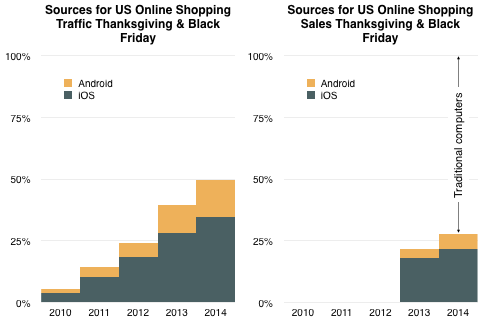
This year’s Thanksgiving and Black Friday data from IBM shows a continuing pattern of growth for mobile devices. As the graph below shows, in the five years since 2010 mobile devices grew from 5% of the online shopping traffic to 50%.  Traditional computing (desktop and laptop) made up the difference.

Screen Shot 2014-12-01 at 10.34.30 AM

The graph also shows that sales value via mobile devices crossed over 25% of online spending. The fact that mobile shopping is not equal to mobile spending is due to the convenience factor of mobile. It’s more likely that users will spend idle time scanning for bargains or tracking down ideas from friends but wait until they are at home to make the final purchase decisions in front of a computer.

The transition to spending directly from a device is a slower process, but that process was also one that online had to undertake as buyers became comfortable with online commerce. When it comes to payment, buyers are understandably more cautious.

This does not change the prediction made last year that “the transition to post-PC consumption will also be practically completed by 2020”. That leaves six years for mobile saturation and a total transition time of one decade.

At that point I expect 90% of browsing and perhaps 75% of spending to be happening on devices. Some of this will undoubtedly be enabled by biometric authentication as shown by Apple Pay. Trust and ease of use in this technology will undoubtedly accelerate the transition making mobile payments more comfortable and secure than on the legacy computer.

What is less predictable is how much those devices will also be used to transact payments for the physical retail stores. In some scenarios it’s possible that by 2020 a majority of all shopping will be enabled by devices.1 That would subjugate the retail segment to the power politics of mobile platforms.

It is interesting therefore to note the mix between the platforms in the graphs above.

  1. There is also the matter of in-store discovery and advertising via NFC and bluetooth i.e. iBeacon []

Yet another billion dollar business

I tried to assess the opportunity of Apple Pay but found it to be mostly dependent on how quickly card payments will overtake cash. It seems that as payments move to a digital format they will move to a mobile device. The hurdle isn’t going from a card to a phone but from cash to card.

Data published in The Growth and Diffusion of Credit Cards in Society  shows that between 1970 and 2001 households with at least one credit card in the US grew from 17% to 70%. More recent data shows 82% of US consumers have at least one credit card and 77% have a debit card.

The Total Addressable Market for Apple Pay then is dependent on how quickly this pattern repeats over the markets where iOS devices are in widespread use. Once cards are in use they are used with higher frequency and quickly overtake cash for the user.

The only assumption that needs to be made is that the device then replaces the plastic card. This seems a safe assumption as the benefits of the device as payment authenticator are high and the costs are negligible given a penetrated market.

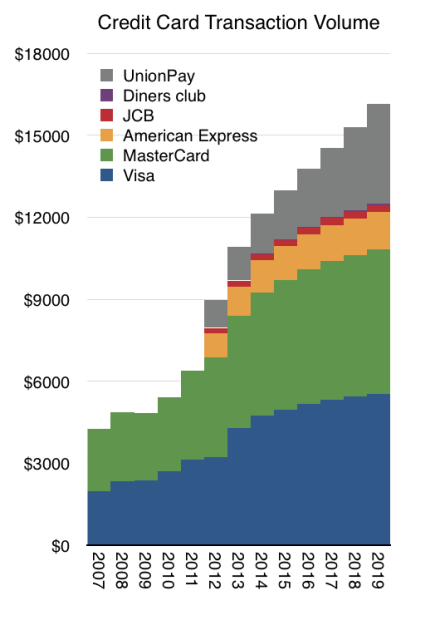
The following graph shows an extrapolation of transaction volumes where Visa and MasterCard and Amex are showing moderating growth with UnionPay showing 20% constant growth through 2019.1

Screen Shot 2014-11-28 at 12.58.21 PM

Two more assumptions are needed: the share of transaction value captured by Apple Pay and the Apple Pay fee. I used 15 basis points ($15/$10000) as the assumed Apple fee and a share schedule as follows: Continue reading “Yet another billion dollar business”

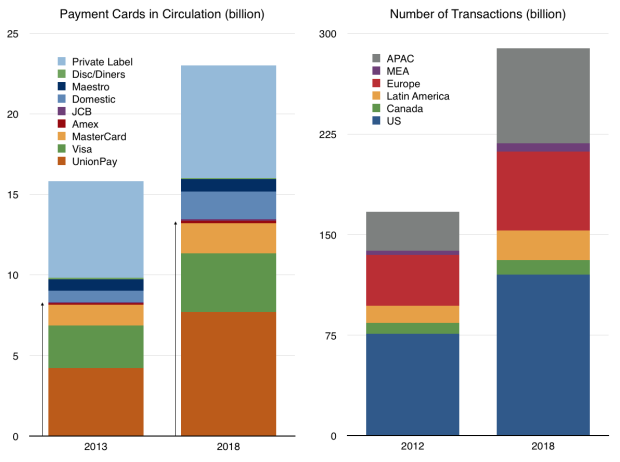
  1. Supporting these assumptions is a forecast from Nilsen showing total number of cards in circulation by issuer and a forecast of total transactions Screen Shot 2014-11-28 at 1.40.01 PM []

The Critical Path #132: The Worlds PIN Code

How does an organizations structure, resource allocation and measurement dictate its capabilities? Horace and Anders discuss Amazons AWS business in comparison to their traditional online retail business and the Apple and Google strategies.

via 5by5 | The Critical Path #132: The Worlds PIN Code.

The Critical Path #131: How Big is iCloud?

Apples Services business is growing by leaps and bounds. How much of that can be attributed to iCloud? Horace and Anders consider how big the iCloud business is for Apple, as well as Apples recent stock price rise in this “rolling show” on the way to the airport.

via 5by5 | The Critical Path #131: How Big is iCloud?.

Asymco

Asymmetric Competition

Skip to content ↓