How big is Apple’s Ecosystem?

iTunes/Software/Services revenues grew at 12%. This was the second fastest segment growth last quarter, with the Mac growing at a slightly faster 13% rate. Apple mentioned in the quarterly earnings conference call the for the first nine months of its fiscal year (i.e. since September) the line item iTunes/Software/Services has been the fastest growing part of the business. The following graph shows the growth scorecard for Apple’s line items and it shows how the iTunes store is the only line that has been consistently green (growing above 10% for at least seven years.

Screen Shot 2014-07-29 at 8.58.53 PM

In addition to its revenues, iTunes can also be measured in terms of billings (or gross revenues). The billings growth rate is even higher at more than 25%. This is mostly to the more rapid growth of apps relative to a decline in music. As Apple only records the 30% it keeps as “revenue” for apps the overall growth in apps is less visible in its accounts.

The relative performance of billings vs. reported revenues is shown in the following graphs: Continue reading “How big is Apple’s Ecosystem?”

A Dollar a Day

There are 80 million Mac users. The last 12 months saw sales of 18 million Macs.

As of the end of June there were 886,580,000 iOS devices sold. As of today the total is well over 900 million. One billion sold will happen well before this year is out. Estimates of current iOS users vary but they are probably at least 500 million and could be 600 million.

Screen Shot 2014-07-25 at 7-25-2.44.06 PM

Apple claims 800 million iTunes accounts.

Therefore, in terms of revenues:

  • Mac User = $289/yr
  • iOS User = $262/yr
  • iTunes User = $25/yr1

Adding iTunes usage to either Mac or iOS yields Continue reading “A Dollar a Day”

  1. Measured from billings []

Is the PC back?

Gartner’s own press release has an interesting spin:

“After Two Years of Decline, Worldwide PC Shipments Experienced Flat Growth in Second Quarter of 2014, According to Gartner”

Gartner’s actual figure is 0.1% growth. Gartner and IDC measure slightly different quantities as “PC” but they don’t disagree much. IDC still shows declining PC sales at about -1.7%. However both also include the Mac in their accounting of PC. If we were to remove the Mac and measure “Windows PC”1 Gartner’s figures would show -0.8% drop in PC ex-Mac shipments.

The difference in growth between the Mac and non-Mac PCs is shown in the following graph.

Screen Shot 2014-07-23 at 7-23-5.23.08 PM

As Apple puts it, the Mac grew faster (and hence gained share) for 31 out of the last 32 quarters.  It missed on this perfect record during the fourth quarter of 2012 when the then fresh new iMac was impossible to buy due to production issues.

So as far as the Mac is concerned the slowing of the decline in PC unit shipments isn’t at its expense. Continue reading “Is the PC back?”

  1. In quotes because this total includes Linux and Chromebook []

IBM and Apple: Catharsis

IBM did not invent personal computing but their “PC” became synonymous with the category. Having entered the market in 1981, the IBM PC quickly became the top selling brand. From 1984 to 1993 IBM sold more PCs than any other vendor, conceding the spot to Compaq which remained on top only until 2000. No PC vendor remained at the top of the sales leagues longer than IBM. HP had the second longest run but that run was broken last year as Lenovo (who acquired IBM’s PC business) surged.

Screen Shot 2014-07-16 at 4.19.11 AM

As the graph above shows, the period of time when IBM was dominant was characterized by far lower volumes. In 2004, the year IBM exited, they sold about 10 million units. ((as the graph shows, if we consider Lenovo as taking over from there, they did a very good job extending the legacy.)) It was a decent performance but one that did not keep up with the Dell and HP/Compaq race to the bottom in pricing and subsequent rise in volumes.

However, throughout its position of strength, IBM was a reluctant PC maker. Continue reading “IBM and Apple: Catharsis”

Airshow is coming to Tokyo

I will be conducting our 10th Airshow event in Tokyo on Thursday, 17 July 2014.

Airshow

The purpose of Airshow is to:

  • Understand how data can be used to persuade through an appeal to logic as well as through empathy.
  • Understand the basics of “data cinematicism” including the techniques analogous to cinematography and direction.
  • Understand story development techniques including how to facilitate the audience’s entry into the story.
  • Learn how to build a cinematic presentation.

The method we devised borrows heavily from the techniques of cinematography and screenwriting to impart meaning to the audience beyond the literal words spoken or images shown on screen. These techniques are demonstrated with “feature presentations” and then deconstructed in interactive lectures. Throughout we also weave Aristotelian rhetorical tips and present from the Asymco repertoire of stories.

See Airshow Tokyo event page for more information. Registrations are available. Students may register for academic discounts.

Innovation and the Future of Mobile, with Horace Dediu

Will Sherlin writes:

Horace Dediu joins us for the 22nd episode of “The Innovation Engine” podcast to discuss innovation and the future of mobile – what the post-mobile world will look like; how Apple, Google, and others are shaping the mobile experience of the future; and the next frontiers of mobile after health and fitness.

In this episode of the podcast, Horace talks about why mobile and smartphones will no longer be thought of as synonymous in the very near future. He discusses how soon-to-be released products like Apple’s HealthKit and Google Fit, combined with the revolution in wearables, will continue to drive change in industries like health care and will put more power than ever in consumers’ hands.

Horace also shares his thoughts on “The Disruption Machine,” Jill Lepore’s New Yorker article that criticizes Clayton Christensen’s theory of disruptive innovation. While he believes there is some merit to the notion that disruption is overused, Horace says the article overlooks years of research and writing since that has helped refine Chrinstensen’s theories. He wrote a post for the Asymco site titled The Disruption FAQ in response to the article if you are interested in reading more of his thoughts on the matter.

Other highlights from the conversation include:

  • What we learned about the Apple New Product Process, or ANPP, from Leander Kahney’s book Jony Ive: The Genius Behind Apple’s Greatest Products
  • Some of the reasons why health care technology lags behind consumer technology, and why that means we are just beginning to scratch the surface of what will be possible in personal health care
  • Other “white spaces” in the marketplace that Horace sees as ripe for disruptive innovation, including education and transportation
  • Why Horace says software, not technology, is the thing with the power to truly transform industries

via Innovation and the Future of Mobile, with Horace Dediu.

The Critical Path #118: The Cook Doctrine

We reflect on why the narrative on Apple has changed post-WWDC and analyze both the evolution and consistency of Apple’s culture. Furthermore, what elements of that culture/process/priority setting can be copied? In other words, what does it take to be great?

via 5by5 | The Critical Path #118: The Cook Doctrine.

Late late majority

Seven years after the iPhone was launched, 70% of the US population is using smartphones. Smartphones existed before the iPhone so the category is older than seven years but as far as adoption goes this is nearly the fastest ever.

The CD Player reached 55% in seven years and the Boom Box about 62%. If measuring the period between 9% penetration and 90%1 the smartphone in the US will have a lifespan of about 9 years starting in 2008. Before this period, the product was largely experimental and participating vendors2 mostly failed. After this period most products will be “commoditized” with decreasing margins and increasing consolidation.

The rapidity of growth is all the more remarkable given the penetration is at the individual, not household level. The total user base is therefore over 270 million rather than the 115 million usually targeted by consumer technology, nearly 60% more purchases. This is also remarkable because the product has a shorter lifespan of use (two years) than is typical for other consumer technology products3

We are therefore now in the “Late Majority” phase of the US market. This is not a surprise. The inflection point in the market occurred in mid 2012 so we’ve been in this phase for two years already. It’s not therefore controversial to predict two years of continuing though decelerating growth.

Screen Shot 2014-07-08 at 7-8-2.39.27 PM

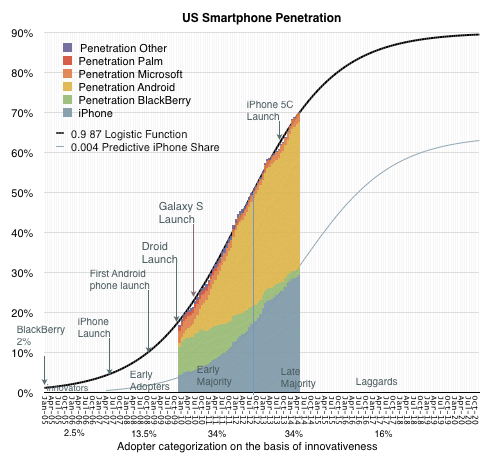
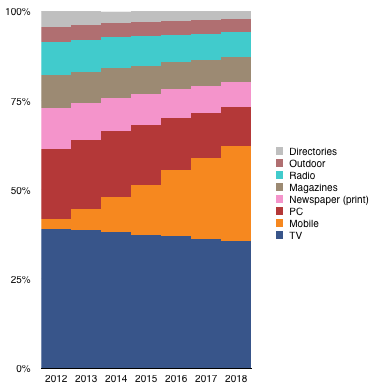
As Geoffrey Moore explained, the marketing of technology products needs to be varied as we get into different phases of the market. Innovators (first 2.5%) need to be sold on the premise of novelty itself. Early adopters (next 13.5%) seek status and exclusivity. Early majority (34%) seek acceptance and Late Majority (34%) seek pragmatic productivity. Laggards (last 16%) seek safety.

One aspect of this adoption cycle that is misunderstood is the role of pricing. The assumption is that pricing matters more as adoption increases. This is misunderstood because pricing always matters and therefore it never matters. Pricing is one of many elements of marketing mix and at any time there are product choices across a wide spectrum of pricing. Pricing is also a signal which can be elaborately obfuscated through bundling and unbundling.

One way to illustrate this is to consider how Apple products behave in the late phases of markets. Apple products have notoriously firm pricing.

Screen Shot 2014-07-08 at 7-8-2.38.26 PM

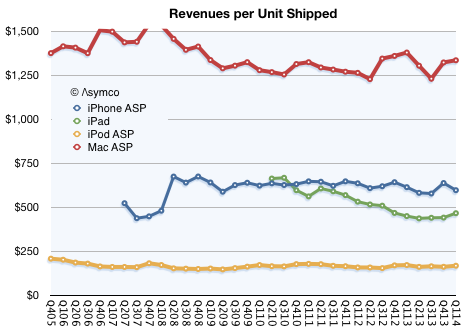
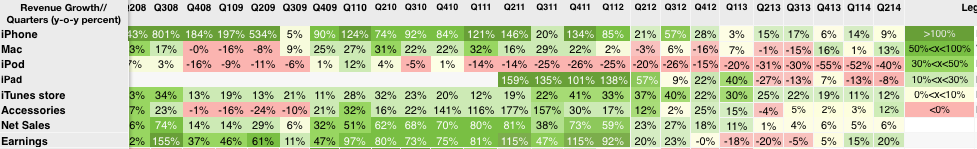
The revenue per unit of Macs, iPods, iPhones and iPads remains stubbornly consistent. This is not to say that each unit sold is the same price. The company tweaks “the mix” of mid, low and high products to keep the average selling price constant. But fundamentally the average remains constant which means that regardless of market phase, Apple retains its margins.

So as we look forward to the last two years of growth for smartphones, how will Apple fare? Continue reading “Late late majority”

  1. which I consider the “economically attractive” period of growth []
  2. Palm, BlackBerry, Nokia []
  3. e.g. TVs, Refrigerators, Radios, etc. []

Competing effectively against your most potent competitor

New market disruptions take root in non-consuming contexts. For instance, mobile phone photography began not because early phone cameras were good. They weren’t good at all but good enough when a camera was not within reach. The quality was poor but the photo taken would not have otherwise been taken, making a lousy photo better than no photo.

The result is that the total number of photos taken this year will be ten times higher than the total number of photos taken before the advent of mobile phone cameras.1

This rush to use the phone as a camera has meant that phone makers are keen to improve their product (so as to compete effectively with it against each other) and as a consequence they overtake the incumbent camera makers in quality as well as quantity.

The same phenomenon was experienced by fixed component “Hi-Fi” audio products. The quality of mobile music was poor but it was convenient and convenience translated into consumption and consumption translated into quality improvement and eventually the evaporation of usage of the traditional category.

Now consider how ad dollars are getting spent. The following chart shows the eMarketer forecast for ad spending mix across different media in the US.

Screen Shot 2014-07-02 at 7-2-8.12.01 PM

It would appear that the “Mobile” media is competing effectively against the other media types, especially the non-Mobile digital (i.e. PC-based experiences).

However, if we look at the absolute spending forecast the picture shows that Mobile is responsible for most of the growth in the overall spending. Continue reading “Competing effectively against your most potent competitor”

  1. The total number of photos taken in 2014 is likely to be around 880 billion. Prior to 2000 the total number of photos ever taken is estimated at 85 billion. []

Apple: Lessons in Self-Destruction. Richard Gutjahr’s blog

My thanks to Richard Gutjahr for taking time to talk about self-disruption. I met Richard as the Master of Ceremonies at the Censhare FutureDays event in Munich. He interviewed me for his blog and posted the results as a video and sound file. Richard is a journalist (Berliner Tagesspiegel, Frankfurter Allgemeine Zeitung) and TV personality (news presenter for Rundschau night).

Horace and I have met at a conference in Germany a few weeks ago. During a break, we were talking about the future of Apple. Horace made a statement, which I found quite intriguing: In order to remain innovative, it is not enough to reinvent yourself again and again. Apple must be the one to destroy its own business.

Hour-long conversation including audio and video: Apple: Lessons in Self-Destruction.


Asymco

Asymmetric Competition

Skip to content ↓