Product, Promotion, Price, Positioning and Placement: The iPhone at seven. The 5C as a new product and the prospect for price reduction. The positioning of the 5S and the potential for the M series and Touch ID.
M is for Mystery
I recently tweeted that any discussion related to wearable technology needs to begin with a description of the job it would be hired to do. Without a reason for building a product, you are building it simply because you can.
The reason a product deserves to exist is that it can do a job that needs doing and that few, if any others can also do it. This happens when the job is unstated and difficult to perceive. Put another way, the difficulty behind jobs-to-be-done based design is that jobs are never plainly evident. In contradiction to invention, where the problem being solved must be as clearly stated as its solution, value-creating innovation meets new and unarticulated needs. Even when created, the value is more subtly perceived, often only after prolonged use.
Which brings me to the M7. Apple chose to highlight a component (curious in itself) which it bills as a “motion coprocessor”. It claims to be measuring motion data via accelerometer, compass and gyroscope and processing the information in some way. By bundling the sensors and their management into one integrated chip battery consumption is reduced and these motion monitoring functions are performed more efficiently.
But what for? The examples given during the presentation for an iPhone with M7 don’t add up to a lot of benefit. An iPhone could be used as a fitness companion but it would not a very good one. Compared with, for example, a Nike FuelBand, an iPhone could not track your activity well. It’s often not moving, sitting on a desk or in a purse or pocket while you are doing exercise. It’s too big to take into a basketball game. It can’t “observe” your activity because it’s not worn during many activities and if it is worn it is in a position which does not inform much about what you’re doing. Phones are too big to be used as physical activity monitors.
Hence the question of what is the M7’s job to be done. As part of an iPhone, it does not seem to have one. Saving a bit of battery life is not a job, and certainly not one that needs to have billing in a media special event. The answer must be that the M7 was developed for some other, as yet unstated reason.
When the A series chips were created Apple leveraged the in-house design and cost reduction to make a wide range of products with more than 700 million examples built. Designing a chip needs a broad application domain.
Perhaps this is why Apple chose to describe the iPhone 5s as “forward-thinking”. The M7 and the Touch ID are like research projects whose actual value will be realized at some future time, in probably different contexts. The M series of chips may become Apple’s “low end” microprocessor as the A series climbs the trajectory into core computing tasks (read: phone, tablets, TV, laptops).
M might be the chip for the wearable segment, woven into a whole new fabric of uses and jobs to be done.
A new platform classification
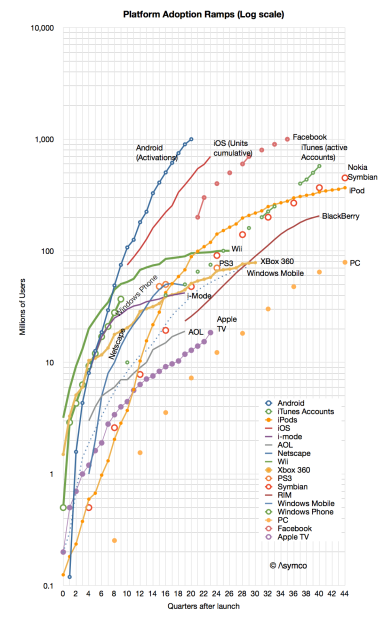
When looking at the Race to a Billion data I noticed that some platform adoption ramps look quite different from others. It’s not just a matter of “slope” or rate of growth but a distinctly different shape.
If you look at the graph below you might see the difference yourself.
First, note that the graph is logarithmic. A straight line on a log chart implies exponential growth (the y values are a constant to the power of the x value). However, none of the graphs show straight lines. None of the platforms follow exponential growth1.
Second, we can eliminate linear or logarithmic functions. They simply do not fit.
That leaves: polynomial or power. It’s easy to test these alternatives for all the functions and it becomes clear that most of the platforms split into one of these two classes.
Continue reading “A new platform classification”
- Except perhaps in the very early periods [↩]
S is for Service
One of the enduring mysteries of the iPhone has been its lack of a portfolio. After six years it seems that Apple has finally acquiesced that there should be one, albeit currently limited to two items. The second enigma is related to the price, namely why does Apple ask so much for its phones? At an average sales price of $600 it’s a shocking premium to the average phone, and with a six year run, a shocking resistance to the corrosive effects of competition.
The obvious answer to why Apple asks so much is because it can. Anybody would if they could. That’s a poor question. So the right question should be: why does anybody pay this much? One could answer that few do and it’s not a mystery that some feel better paying more simply because they can. But those who pay Apple’s prices are, mainly, not consumers. They are operators. Exactly 270 of them.
So then let’s re-ask the question: Why do so many operators pay so much for Apple’s phones? We can’t answer that with the psychological slurs usually directed at the brand. Surely Operators aren’t competing in beauty contests or need to soothe their collective egos. The decisions operators make on whether to range a phone are driven by hard economic realities: ARPU, churn, network costs, depreciation, ROI, etc. Some clearly can’t make the iPhone fit their economic models and indeed about two thirds of them don’t. But the most prominent1 do. DoCoMo, the largest in Japan just did after holding out for five years. Verizon held out for years, as did T-Mobile. China Mobile’s acceptance also seems imminent.
But that still leaves the question of why are those operators who do carry the iPhone willing to pay so much for it? I only assume that their decision process is likely to be rational. Mainly because we have a large enough sample but also because there is a lot of money at stake requiring quite a bit of internal consensus and vetting before committment. We have to conclude that operators place the orders because they obtain value from the iPhone even when it’s priced at a premium to the average alternative.
The question which follows then is how do they obtain value? Continue reading “S is for Service”
- Arguably the most important [↩]
C is for Cognitive Illusion
My assumption going into this, sixth iteration, of the iPhone was that we would see the expansion of the iPhone into two distinctly positioned products: a low-end C and a high-end S. The assumption was based on what what we saw with the iPad: the regular iPad and the mini iPad.
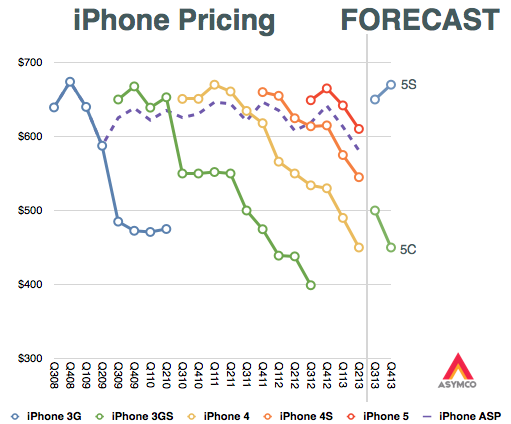
By using the iPad as a template, my exercise in August was to forecast what the pricing1 might turn out to be for such a split-personality product.
I expected the 5C would replace the “low end” n-2 variant2 and the 5S would continue as the core product. This is reflected in the original graph as devised in mid-August:
The surprise was that the 5C was not “low end” in any way other than having a plastic case. It has a minor spec increase over the 5 but is otherwise a 5 feature set in a plastic skin. It also is priced as if it was the continuation of the 5, with a modest reduction in ASP.
In addition, the continuation of the 4S and 4 (in China at least) means that the old strategy continues more-or-less unchanged.
Knowing the line-up and pricing all that remains to understand is the positioning, or how the products are defined relative to each other.
This is where there might be a shift happening. Under the old model the n-1 variant was meant to be a modest volume contributor to the portfolio, being essentially a cognitive illusion which encouraged buyers to stick with iPhone n at the expense of competitors. However, the new n-1 product (the 5C) has a distinct positioning that makes it seem fresh and not a lesser, stale version of the flagship. It is designed to appeal as a legitimate upgrade for iPhone 4/4S users. It is, in other words, not meant as an illusion, and not focusing attention on the flagship3. Rather, it is meant to be a genuine, core product.
As a result, I expect the mix of iPhones to be more evenly split between the C and S variants. I expect the C to even become the most popular version in the mid-term. My expectations are shown in the following graphs. Continue reading “C is for Cognitive Illusion”
5by5 Specials #22: Apple Event: iPhone 5c and 5s
Dan is joined by Christina Warren, Horace Dediu, Benedict Evans, and Haddie Cooke to discuss their thoughts on the September 10th Apple Event announcing the iPhone 5c, iPhone 5s, and more.
via 5by5 | 5by5 Specials #22: Apple Event: iPhone 5c and 5s.
My interview with Chloe Cho on CNBC Asia's Cash Flow show
My thanks to Kirk Burgess for providing this transcript:
Horace Dediu interview on CNBC Asia Cash Flow show – 10th September 2013
Chloe Cho (CNBC): Take us through what Apple is exactly trying to do?
Horace Dediu: Well, this is the first time in the six years of this competition in the smartphone market that Apple has broadened its portfolio. We have seen only a single product launch every year–this is very unorthodox in the industry. Normally each competitor [ranges] dozens of devices. Apple’s entry has been asymmetric from the start, and now in its sixth year we are expecting to see, finally, a broadening perhaps into two separate products. The question will be whether [there will be] a significantly lower price point for the so-called 5C and whether that will change the average selling price overall for the portfolio. The average selling price has been remarkably steady, and remarkably high, typically around $600 for the duration of this products life. Something, again, unprecedented. My expectation is the new price point will be quite a bit lower than $600, starting with about $450, it might drop a bit further, [which] would cause the overall price range to come down as we have seen with the iPad; [where we] also had a price erosion happen as the smaller version came out.
Q: Horace, do you think they have got the timing right? Should they have done this a little bit earlier when the market wasn’t so saturated and filled with cutthroat competition? Continue reading “My interview with Chloe Cho on CNBC Asia's Cash Flow show”
Game over
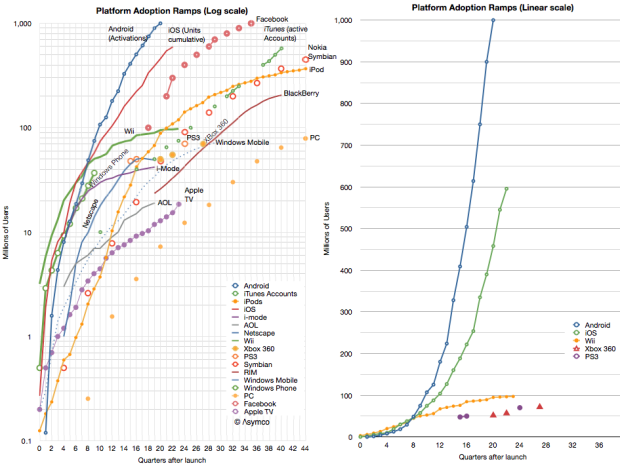
In the “Race to a Billion” there is a graph showing Android reported activations and iOS cumulative unit sales alongside cumulative console sales. The contrast between mobile phone platforms and game consoles is striking, with an order of magnitude difference in consumption. The best performing console to date is the Wii with about 100 million units sold so far.
[UPDATE: Thanks to Danny Nemer cumulative sales of Sony’s PlayStation 2 (using production shipments from FY 2000-05 and recorded sales for FY 06-12) is 155.81 million units]
However, that is an incomplete picture of the game platform business primarily because consoles are not the entirety of the business. Mobile (but dedicated) gaming platforms have been sold for some time.
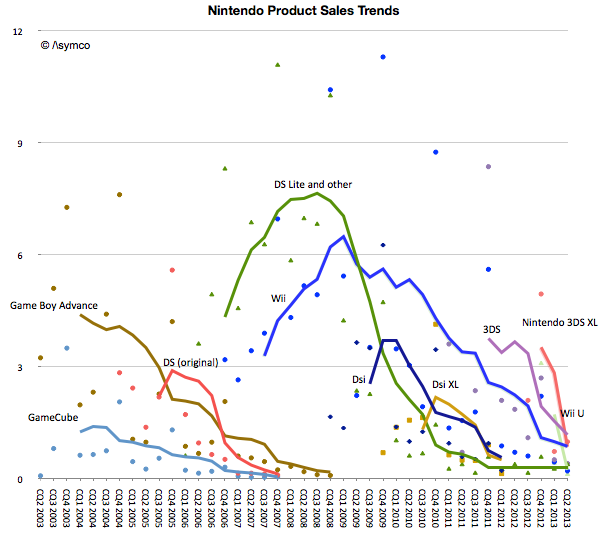
To give a better picture of the game business we prepared the following graphs. The first shows Nintendo’s product lines with actual unit shipments (shown as colored dots in millions of units per quarter) and the trend (shown as trailing twelve months’ average trend lines).
Note that fixed and mobile products are both shown on the same graph. The picture that emerges is that for Nintendo, its mobile platforms combined are more popular than its fixed consoles with a total of 186 million mobile devices sold since 2003.
There is also a pattern of generational change. The GBA, DS and GameCube era was superseded by the DS Lite, DSi, Wii era. The Wii era (or generation) was significantly more popular than the GameCube generation. If there is a problem however, it seems to be that the new generation devices or consoles are not forming a new era. The Wii U and 3DS are not growing nearly to the level of the previous generations and have faded quickly.
To summarize, the unit volume graph for Nintendo is below.1 Continue reading “Game over”
- This is a smoothed graph showing what sales would have been if they had been evenly spread out over a 12 month period. The actual sales would total to the same area but would be much more seasonal and thus noisy. [↩]
The Critical Path #95: Catharsis or Anticlimax?
A special episode in three parts: 1) Too many variables: The mechanics of the Microsoft Nokia deal 2) Climbing Everest without oxygen: The implications for Microsoft and 3) Post-abyss: The implications for Nokia.
via 5by5 | The Critical Path #95: Catharsis or Anticlimax?.
This one starts slow but ends with a flurry.
Third to a billion
Android is the third platform to reach a billion users1 . The first was Windows and the second was Facebook. Apple sold around 650 to 700 million iOS and is expected to be the fourth to a billion sometime next year.2
If we define the Race To a Billion to be bounded by a time limit of 10 years, then Windows does not qualify and Android is actually second. The race is shown in the following graphs (the one on the left is logarithmic scaled, the one to the right includes only a few contenders for illustrative reasons).
Android’s activations as reported are shown in the following graph: Continue reading “Third to a billion”


