A report on Ùll with recollections from Don Metlon and Michael B. Johnson (Dr. Wave): what is a functional organization and why is that a thing of beauty? What do Pixar and Apple have in common? What is Horace’s favorite Pixar movie? Also a new mini-installment on “Asymcar”, what’s wrong with cars?
Escaping PCs
The Windows PC market is contracting. The market data has been showing unit shipment declining for some time with the latest quarter having perhaps the steepest decline for two decades.
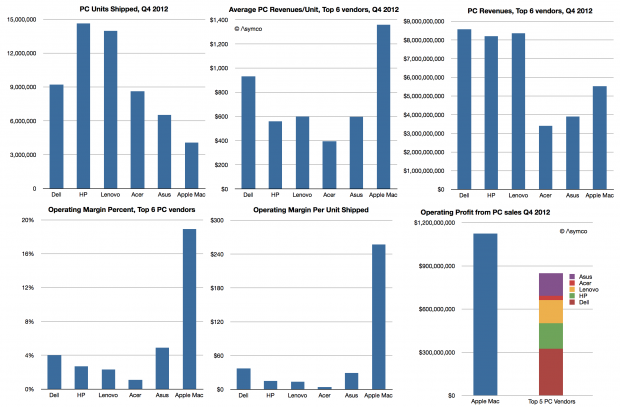
What remains undocumented however is how the market looks when considering economic value. A more complete picture would be to show revenues, average selling price (or revenue/unit), operating margins/unit and percent of profit capture.
The data is not beyond reach however. It involves combining the shipment estimates from e.g. Gartner with financial reports from the companies themselves. Some analysis is required to estimate margins but they are also not hard to obtain (e.g. from third parties.)
So here is a view of the market for the fourth quarter 2012:
Spaceship
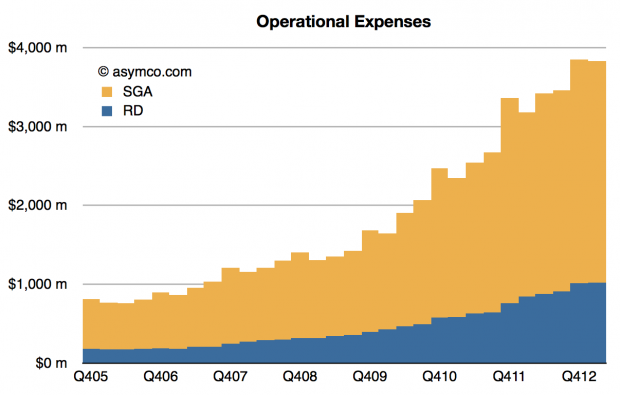
To anyone who has visited the current “campus”, it’s obvious that Apple has outgrown it some time ago. It’s also obvious given the increase in headcount and operational expenses over time as can be seen below:
(I added Q1 2013 estimate based on company guidance.)
One can understand why, from a practical point of view, they want to consolidate what amounts to at least twice as many people back into one place.
But there is also a more subtle reason and it has to do to a fundamental distinction: Continue reading “Spaceship”
Happy Birthday iPad
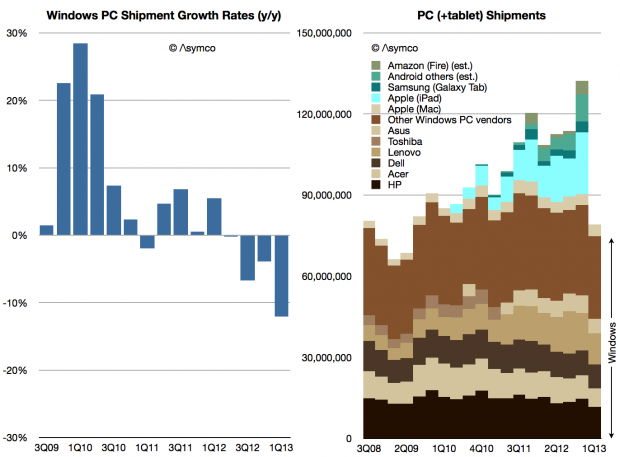
The latest data on PC shipments from Gartner showed a decline of 11.1% from the first quarter of 2012. As we don’t yet have the final data on Apple’s Mac shipments, I used my estimate of 4.38 million units (14% growth as per NPD estimate for the US) to obtain an estimate of Windows PC shipments.
That number is 74.8 million units. In the first quarter of 2012 the corresponding calculation yields 85.1 million units. That makes Windows PC rate of decline -12%.
The historic shipment data and growth rates are shown below:
Note that tablet data is not yet included in the shipments summary. Windows shipments are shown in shades of Brown and tablets in shades of Blue/Green.
The decline in PC shipments is persisting and even accelerating.
Coming only a week after the iPad’s launch birthday, it’s perhaps a fitting testament to its impact.
Making rain
The following is a slightly edited transcript of a portion of the Critical Path podcast #79. I am reproducing it here for the sake of brevity and focus of discussion.
—
I’m going to try to put together an analogy together here that maybe will help us think through the Facebook Home and the Google Fiber issue.
I’ve been thinking a lot about how to illustrate Google’s business model. The problem is that discussion has been polarized: Two camps have formed. One camp suggests that Google is a benevolent entity that does great things and only asks that we indulge their hobby of a business model called advertising. Fundamentally they are about pushing the envelope on technology, making wonderful things happen.
That is one camp. I call them the utopians. It may not be a nice thing to call them but I frame it as being exceedingly idealistic.
The anti-utopian camp is one that suggests that Google is an advertising company primarily, and fundamentally and overwhelmingly. And anything they do technologically is in support of that. The implication is that Google is sinister and manipulative, bent on getting away with as much privacy extraction as possible.
I believe that the anti-utopians dismissing Google as an advertising company sounds a bit incomplete. It’s not incorrect. It’s not erroneous. It’s just not a complete story.
The Critical Path #79: Make It Rain
This week we cover a bit of Facebook Home, a bit of YouTuber economics, the best analogy ever heard for Google’s business model, and we kick off Auto industry analysis with the “Five Whys”-the paradoxical questions that nobody seems to be asking about cars.
via 5by5 | The Critical Path #79: Make It Rain.
This was a good one.
Samsung vs. Google: an Interview with Rafael Barbosa Barifouse of Redacao Epoca
On Mar 18, 2013, Rafael Barbosa Barifouse – Redacao Epoca – Editora Globo asked (and I answered):
Q: Why is Samsung creating Tizen?
A: I believe they are collaborating on Tizen development because they want an alternative to Android and because Bada was not good enough to meet that goal. Tizen’s roots include contributions from Intel, Nokia and several Japanese companies so it’s not Samsung’s OS per se. Historically it was the “open” alternative operating system for embedded and mobile systems. See https://github.com/kumadasu/tizen-history/blob/master/tizen-history.pdf for a historic perspective.
In some ways Tizen seems to be a blend of several pieces of code including proprietary Samsung user interfaces. Samsung is presumably interested in having a unique, differentiated experience. This is something every device maker seeks. Put another way, if they did not seek this then it’s unlikely that they would be profitable which would also imply that they would not invest in marketing and development of products. As Samsung invests both in marketing and development it can be concluded that they seek to offer a unique value proposition and, in today’s market, that means a unique experience.
Does it make sense to create a new mobile OS when it has had so much success with Android?
Continue reading “Samsung vs. Google: an Interview with Rafael Barbosa Barifouse of Redacao Epoca”
Reasons for iOS outperformance in the US
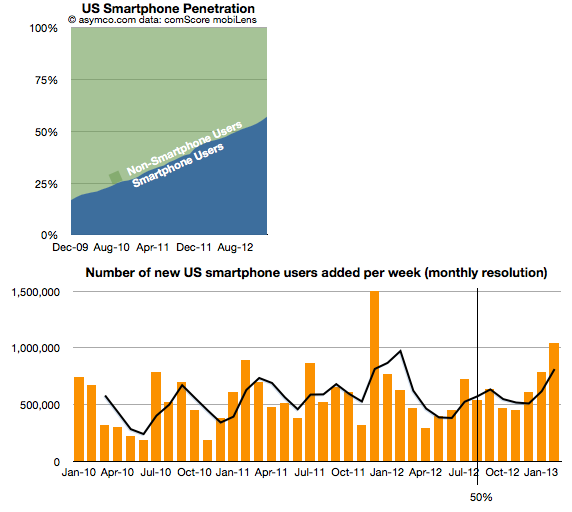
The comScore mobiLens survey for the US ending February 2013 shows continuing rapid expansion of smartphone usage in the US. Even though the 50% penetration threshold was passed seven months earlier, the rate of new smartphone users was second highest ever recorded with over 1 million new-to-smartphones users every week during February.
Overall penetration increased to 57% with nearly 2% of the population switching in one month. Using the average growth rate for the last six periods, the US could see 80% penetration in another 19 months or by Q3/Q4 2014.
The cost of building Galaxies (and iPhones)
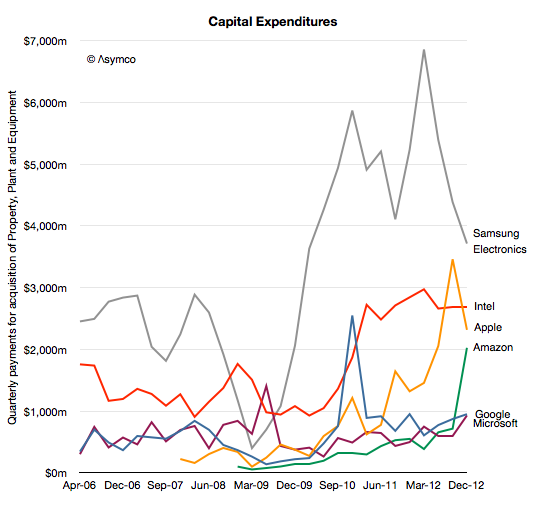
Although Samsung and Apple are acclaimed as the leaders in profit capture for smart (and otherwise) phones, what is not lauded is how much they spend on capital equipment used in the making of these phones.
In 2012 Samsung spent around $20 billion while Apple spent about $10 billion (excluding leasehold improvements or Apple stores but including real estate).
Compare these figures with Intel at $11 billion, Google at $3.2 billion, Microsoft about $2.8 billion and Amazon $3.8 billion (including presumably new distribution centers.)
What each company spends on differs depending on its business model, but as the graph above shows it’s easy to see that there is a class of “big spenders” who spend so much that it makes it hard to imagine just what $10 billion/yr could actually buy.
To get an idea of just how big that figure is consider that Continue reading “The cost of building Galaxies (and iPhones)”
Happy Birthdays
Today is the iPad’s third birthday. It’s also the mobile (cellular) phone’s 40th birthday.
Whereas the launch of the mobile phone was probably an obscure event, the launch of the iPad was greeted with derision.
It is perhaps with irony that we should greet this auspicious confluence of anniversaries.

