Margin Call

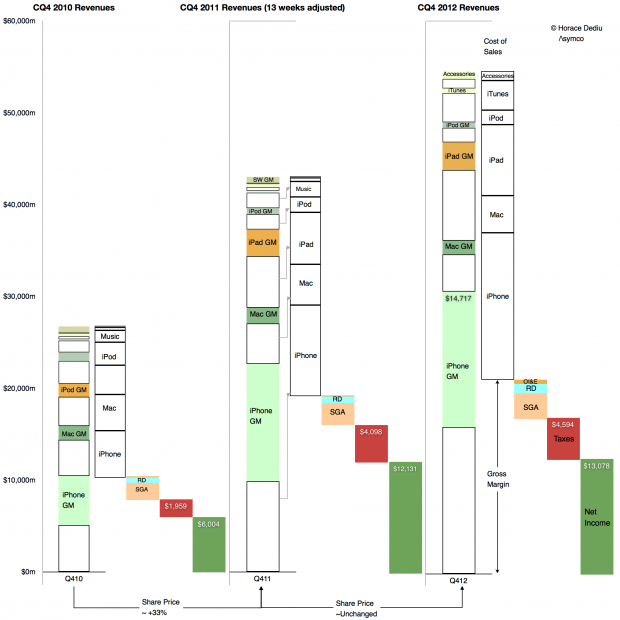
During the fourth quarter 2012 Apple’s margin fell to about 38%, a level not seen since two years earlier and down from a peak of 47% in Q1 2012. Does this lower margin foretell lower prices or a loss of competitiveness?

Obviously not.

Gross margin is a function of Sales (aka revenues) and Cost of Sales. Gross margin as a percent is calculated with the following formula: (Sales-Cost of Sales)/Sales. If dealing with a single product, Sales itself is the product of shipments and price/unit but since cost of sales is also a product of shipments and cost per unit, the shipments numbers cancel each other out and the gross margin reduces to the ratio of (Price-Cost)/Price.

So a margin drop can only be caused if one of three things happened:

  1. Prices dropped
  2. Costs increased
  3. Both prices dropped and costs increased.

We can easily find out which of these was the cause in the fourth quarter because we have volumes and prices for all of Apple’s products. We can also derive total costs based a total gross margin. These are illustrated in the following retina-friendly diagram.

Screen Shot 2013-02-05 at 2-5-11.25.16 AM

Continue reading “Margin Call”

Apple's Calendar Fourth Quarter 2012 Growth Scorecard

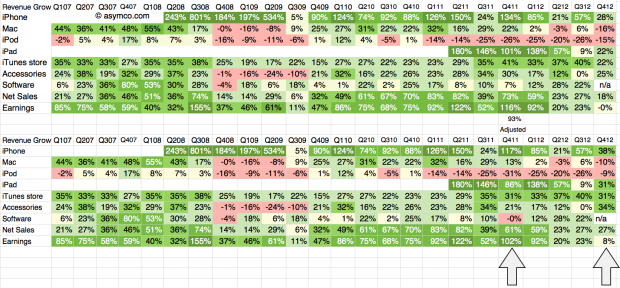
The fourth quarter of 2012 was 13 weeks in duration while the fourth quarter of 2011 was 14 weeks. The difference implies that a comparison of revenues should be done with an adjusted 93% of the 2011 values. The growth for 4Q 2011 relative to 4Q 2010 should also be adjusted on this basis.

The following tables show the unadjusted and adjusted growth rates. The adjustments apply to the bottom table and the columns highlighted.

Screen Shot 2013-02-04 at 2-4-7.19.18 PM

As in previous scorecards, I used the following color scheme to “grade” the performance. Continue reading “Apple's Calendar Fourth Quarter 2012 Growth Scorecard”

It's a wrap. Asymconf California

My thanks to all those who made Asymconf California the best Asymconf ever. We had over 200 attendees and, for the first time ever, 50 workshop participants and a panel session. The venue was spectacular: IBM’s historic Almaden Research Center and special thanks to Paul Brody of IBM for making it available.

Engagement was stronger than ever and I believe we moved the ball forward on a range of topics: The workshops helped solve some of the mysteries related to Amazon valuation and the main event looked at the limits of growth. The State of the Union took a look at the post-PC world and Apple’s inflection point. The panel session took on the future of TV and, including the audience, we had input from some of the most influential companies in the space.

We will scramble to make the proceedings (in the form of an iPad download) available as soon as possible.

Normal blogging and tweeting will now be resumed.

The job the iPhone is hired to do

In the latest quarterly report Apple changed how it reports product revenues. In previous quarters the iPhone and iPad were reported including accessory revenues while iPod accessories were reported under “Music” revenues.

“Under this new format revenue from iPhone, iPad, Mac and iPod sales is presented exclusive of related service and accessory revenue […] revenue from all Apple and third party accessory sales is presented as a single line item [Accessories.]”

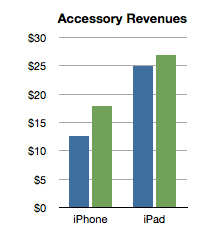
Apple provided a document showing re-classified product summary data.  By measuring the difference between original revenue and re-stated revenue per product we can determine how much service and accessory revenue was being attached to each product.

I did this for two quarters as a sample:

Screen Shot 2013-01-24 at 1-24-2.16.14 PM


The analysis shows that the iPhone has been receiving about $15 of accessory attached value and the iPad about $25. Interesting trivia, but how is this insightful?

Consider the impact on this analysis of revenues/unit shipped: Continue reading “The job the iPhone is hired to do”

What's up with text messaging?

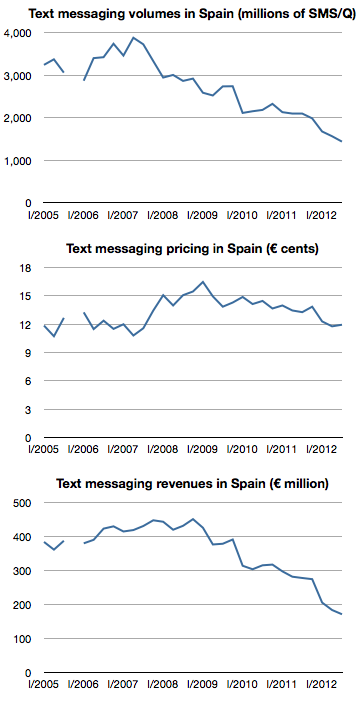
The following graphs show text messaging volumes, pricing and revenues for SMS in Spain.

Screen Shot 2013-01-18 at 1-18-2.40.39 PM

After peaking at the end of 2008 at about €450/quarter, revenues have fallen by 60% to about €171 million in the third quarter of 2012. These figures represent almost 100% operating profit for operators so the impact is felt directly in the bottom line. Continue reading “What's up with text messaging?”

The iPhone MOQ

[Kaoru] Kato, president of NTT DoCoMo Inc., said that the firm would want to add the iPhone to its lineup of serviced smartphones if it could form a mutually beneficial contract with Apple, Inc.

Apple requires that carriers servicing its devices sell a fixed amount per year. Katō said that his company could handle such quotas if iPhones accounted for approximately 20%-30% of its overall smartphone sales.

via NTT DoCoMo President Interested in Servicing iPhone — BrightWire

When thinking about an iPhone launch, especially with a new operator, the crucial question is what is the minimum order quantity (MOQ). Some of the iPhone production is sold direct (as in the case of orders coming from Apple’s online store) but the majority of units are sold via operator who order in batches.

This issue came to light when Sprint’s order was leaked in late 2011.  I discussed the order size at the time and put it in context. I concluded that Sprint MOQ was on average 7 million/yr., ramping with 4, 6, 9 and 12 million over a four year period.  I concluded that this was not a particularly aggressive gamble.

Data published since then shows that Sprint actually sold 6.3 million during the first year, well ahead of my expected minimum order of 4 million and above even the expectations for the second year of sales. So far then Sprint and Apple gauged minimum demand quite accurately.

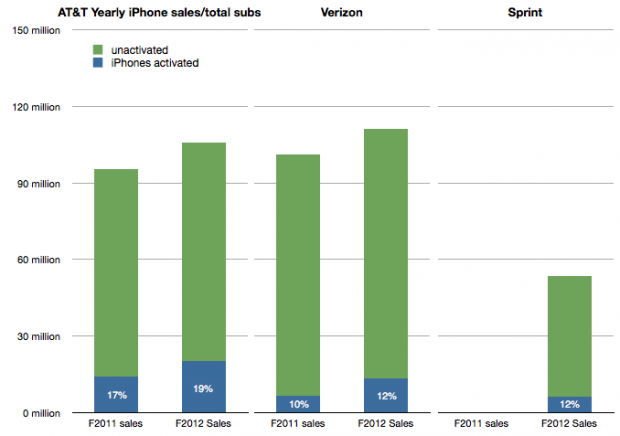
I also showed that the Sprint MOQ was probably indexed off their sub base. I suggested that, based on subs data at the time, Sprint was committing to roughly 13% of its subs buying an iPhone every year. This was indexed off the data showing that 17% of AT&T subs were buying iPhones every year and 10% for Verizon. (I also assumed that this run level would be ramped over time).

The updated totals for the 12 months ended October 2012 are 19% of AT&T subs purchased an iPhone, 12% for Verizon and 12% of Sprint. The performance is shown in the following graph:
Screen Shot 2013-01-17 at 1-17-3.33.10 PM

Which leads us to think about how the MOQ for the iPhone is calculated. If we assume Sprint and Verizon performance is typical it would imply that an operator like DoCoMo would be required to purchase iPhones at the rate of about 10% to 12% of its sub base each year, modulated to some degree by a ramp.

NTT DoCoMo had 60.7 million subs in September 2012. 10% is about 6 million. Is Mr. Kato’s quote above of 20%-30% of smartphone sales consistent with this?

In an earlier interview (in July) Mr. Katō also stated that the target for smartphone sales in the year to March 2013 was 13 million. 30% of that would be 4 million units.

This suggests that the iPhone MOQ for DoCoMo is only about 6% of subs. (4 million) Perhaps this is the basis of negotiation for an iPhone deal. Apple may have held out for 10% subs/yr. with Sprint on the basis of performance of the iPhone in the US but might be willing to settle for 6% subs/yr with DoCoMo, at least for the first year.

The MOQ figure as percent of subs for China Mobile would also be an interesting point of debate.


The race to a billion—2012 Update

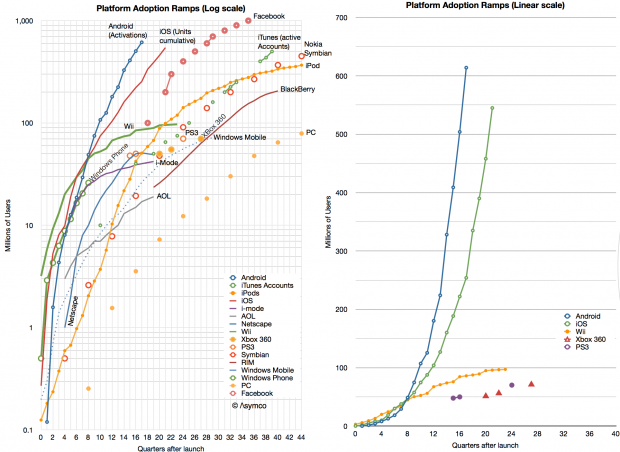
I last looked at the race to a billion in March 2011. Since then, I’ve been updating and adding data to the set giving a broader selection of platforms to compare.

Before we dive in, an explanation: the initial review excluded Windows (PC) and Facebook mainly because (a)  the ramp scale I’m using is about a decade in duration and (b) I was reluctant to compare platforms that require payment to join to those that don’t. The (DOS/Windows) PC ramped over several decades (starting in 1981) and Facebook is a service that costs nothing to join. There was much gnashing of teeth and shaking of fists as a result.

Therefore, in the interest of inclusion, I added both to the data set and let the chips fall where they may.

The data is shown below.

Screen Shot 2013-01-16 at 1-16-2.11.50 PM

I kept the scale to about a decade so that individual lines can be resolved. As a result, you’ll note that although Windows reached one billion first it did so slowly enough to be off the scale shown. Indeed, the “race to a billion” should be titled  “The race to one billion users in less than a decade”.

In such a competition, the winner would be Facebook which, in October 2012, 35 quarters after launch, reached the finish line. The second looks to be Android (probably this year) and the third iOS (sometime next year.)

That may sound like the end of it, but what the graph also shows are the more subtle trends: Continue reading “The race to a billion—2012 Update”

Measuring iPhone 5 vs. iPhone 4S availability

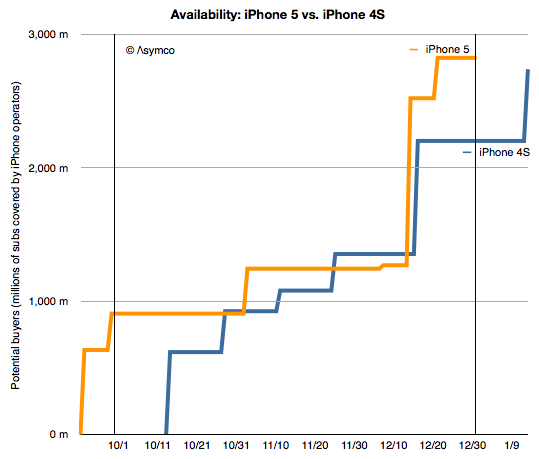
In 2011 Apple increased the availability of the iPhone by adding operators. In 2012 Apple increased availability by bringing the phone to operators more quickly. The question is: how much did iPhone 5 availability increase, exactly?

There is a way to find out. As an approximation, Apple periodically reports the availability of new iPhones by country. For example, Apple stated that they reached 100 countries for the iPhone 5 before 2012 ended. They also gave similar launch data for the iPhone 4S. Graham Spencer did a good job showing how country roll-outs changed over time.

However, country-level availability is not ideal because countries vary greatly in their ability to absorb iPhones. Announcing availability in Mauritius is not nearly as important as announcing Madagascar. A better measure would be to track the countries’ populations being added, or, better still, the populations which subscribe to operators who have a distribution contract with Apple.

Which is what is shown in the following graph:

Screen Shot 2013-01-15 at 1-15-2.29.36 PM

Continue reading “Measuring iPhone 5 vs. iPhone 4S availability”

Asymco

Asymmetric Competition

Skip to content ↓