In search of Apple's microprocessor

Digitimes Research published an estimate of the allocation of production of application processors by Samsung. It suggests that Apple will transition away from Samsung as a processor supplier during 2013 and stop sourcing altogether by 2014.

Most current capacity (nearly 70%) is said to be allocated to Apple’s products. The iPhone, iPad and iPod touch consumed an estimated 226 million processors in 2012. That demand is expected to increase but it will increasingly to be met by other suppliers in 2013. However, Samsung’s own products will take up some of the slack.

The following graph shows the estimated production schedule by customer.
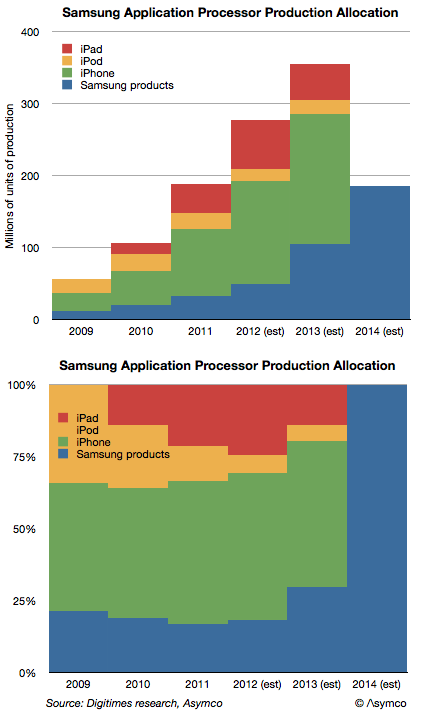
Screen Shot 2012-12-28 at 12-28-9.57.37 AM

There are several questions that this data raises:

  • Does Samsung’s microprocessor production exceed that of Intel?
  • Who will produce Apple’s processors after 2013. Will it be one or more suppliers is also an open question.
  • Is Apple’s CapEx (est. $10 billion/yr.) being spent on some of this future capacity? A modern fab costs about that much.
  • As the iOS processors are Apple’s own designs, will Apple be integrating production and design?

Prior to his departure Intel’s Paul Otellini had begun speaking about manufacturing. He argued that the “fabless” model was no longer competitive and that design and manufacturing should be re-integrated.

I think we’re about to find out to what degree that will happen.


Call for Volunteers for Asymconf

If you are available January 29th and/or 30th in the San Jose area we could use your help.

We need eight people to help with registration, microphone relay, guides.

We also need five people to act as Camera Operators – we will provide Cameras and training, but any experience is a bonus.

We also need an Audio Mixer Operator – experience as a DJ is enough.


In exchange for a day of hard labor you’ll get:

  • Access to event (when not busy)
  • Access to reception and meals
  • A collectable Asymconf t-shirt

Send email to volunteer@asymco.com to apply.

Accommodations for Asymconf [Updated]

We recommend staying at the Hayes Mansion

200 Edenvale Avenue, San Jose, CA 95136

Phone: +1 866.981.3300

The workshops will be held here on January 29th.

(Three One more workshop seats are available).

Update: Workshops are sold out.

Update 2: Use this link to reserve a special event rate of $149/night. You can also reserve by calling the number above and asking for the Asymco rate.

The uncanny similarity between EU and US smartphone markets

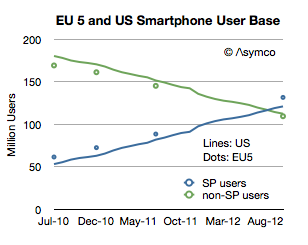
comScore released one of its rare updates to the EU5 (Spain, UK, France, Italy and Germany) smartphone market. Note that the data is claiming to show installed base and not sales in any particular period. What interests me is a comparison or contrast between the European market and the US market.

First, total users.

Screen Shot 2012-12-19 at 12-19-7.30.57 PM

The EU has about 500 million inhabitants while Europe overall has 731 million. The EU 5 total about 314 million which is very nearly the same as the US (311.6 million). Therefore the EU5 is a good comparable to the US in terms of population. As the graph above shows it’s also remarkably similar in its adoption of smartphones. Note that the scale reflects users and since the populations are very similar then the penetration should also be similar.


5by5 | The Critical Path #67: Manufacturing Flying Cars

On Samsung’s use of Capital, Value Chain Evolution and Below the Surface. Why would you read the balance sheet of a tech company, the difference between R&D and capital spending, how to prevent suppliers becoming competitors and what are the economics of systems and application software in a device-centric model. Finally, why you shouldn’t confuse obscurity with secrecy.

via 5by5 | The Critical Path #67: Manufacturing Flying Cars.

How much do maps cost and what are they worth?

How much does it cost to have the world’s best maps?

The answer may seem simple: $8.1 billion.

That was the cost to Nokia in cash for buying Navteq in October 2007. It would seem that buying that asset (or another one like it) is a cut-and-dried solution to anyone needing a mapping “solution”. But it’s not an answer that is either complete or explanatory of how mapping solutions are valued.

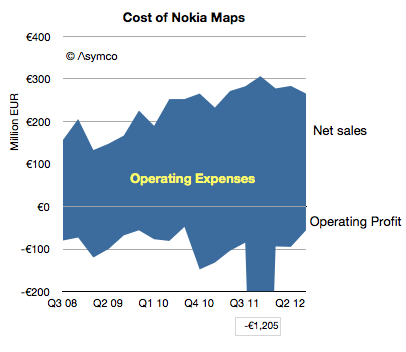
Navteq was not priced as a database for an app. It was a business which was expected to create licensing revenues and profits[1]. The actual price for this business net of cash was $7.7 billion but the following graph shows the net sales and operating profits since Nokia began reporting its performance:

Screen Shot 2012-12-18 at 12-18-3.13.12 PM

The blue area represents the difference between sales and costs and hence the operating expenses–the payments needed to “keep the lights on”. Continue reading “How much do maps cost and what are they worth?”

Calibrating launch performance for the iPhone in China

When the iPhone 5 launched Apple promised availability in 100 countries before the end of year. This was a very aggressive plan given the gradual release of previous products. Last year the iPhone 4S only arrived in China (along with 21 additional countries) on January 13th. This year it was almost a month earlier.

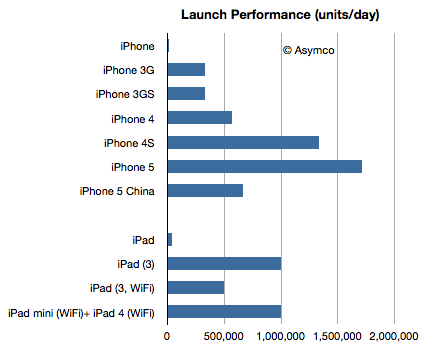
Apple also announced for the first time this year first weekend sales for China: 2 million. This is, as far as I know, the first weekend sales data for a single market outside of the US. The time span was three days and therefore the daily sales rate was 2/3 million per day.

The following chart compares the launch performance for the launches which Apple reported:

Screen Shot 2012-12-17 at 12-17-2.44.04 PM

If we normalize by population, Continue reading “Calibrating launch performance for the iPhone in China”

Below the Surface

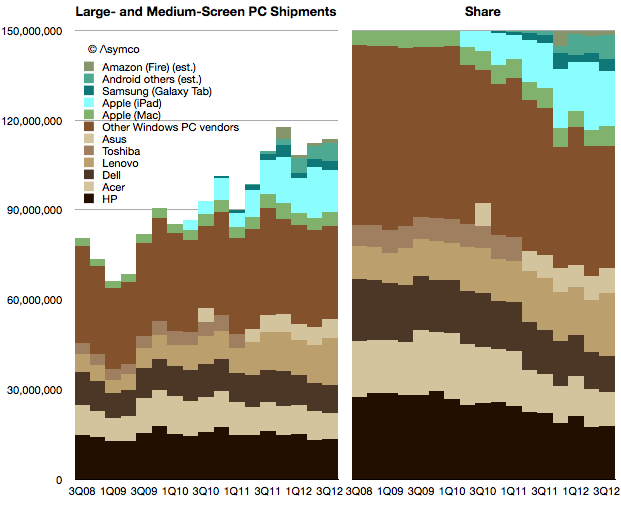
Early data shows that the PC market has not experienced a “pop” from Windows 8. Market watchers have been anticipating this pop since every previous version of Windows has led to a surge in shipments. PC vendors have also been hoping for this to lift their volumes. Volumes have been stagnant for a while, as the following chart shows:

Screen Shot 2012-12-13 at 12-13-3.45.58 PM

If we combine the traditional PC and tablet markets—what I refer to as “large and medium screen PCs”— there has been growth. However the growth is all due to the tablets. When seen in a share split (blue tablets vs. brown Windows PC’s) the shift toward tablet computing is clear. Continue reading “Below the Surface”

The new age of Capital Intensity

In the post reviewing Samsung’s Capital Structure I noted that its component divisions have historically taken 90% of capital investments and that the overall capital intensity for Samsung Electronics has increased in proportion to its component revenues.

In another post regarding the capital structures of other technology companies with different business models I noted that Apple has changed its capital structure to a significant degree over the previous three years.

In the following graph I combined these observations to show how capital expenditure patterns may be used to discern the underlying business model.

I would group “cloud” or “platform” based companies like Google, Amazon and Microsoft as a cohort which, although spending significant amounts on capital equipment, do so mainly to support services. Their primary employment of capital is to sustain the infrastructure of data centers necessary to deliver the services underpinning their business models.

Continue reading “The new age of Capital Intensity”

Asymco

Asymmetric Competition

Skip to content ↓