Samsung's Capital Structure

Having described the Revenue, Operating Margin and cost structure for Samsung Electronics it’s time to review their investment strategy.

The Economist summarized it well:

[Samsung’s] businesses look remarkably disparate, but they share a need for big capital investments and the capacity to scale manufacture up very quickly, talents the company has exploited methodically in the past.

Samsung’s successes come from spotting areas that are small but growing fast. Ideally the area should also be capital-intensive, making it harder for rivals to keep up. Samsung tiptoes into the technology to get familiar with it, then waits for its moment. It was when liquid-crystal displays grew to 40 inches in 2001 that Samsung took the dive and turned them into televisions. In flash memory, Samsung piled in when new technology made it possible to put a whole gigabyte on a chip.

When it pounces, the company floods the sector with cash. Moving into very high volume production as fast as possible not only gives it a price advantage over established firms, but also makes it a key customer for equipment makers. Those relationships help it stay on the leading edge from then on.

The strategy is shrewd. By buying technology rather than building it, Samsung assumes execution risk not innovation risk. It wins as a “fast follower”, slipstreaming in the wake of pioneers at a much larger scale of production. The heavy investment has in the past played to its ability to tap cheap financing from a banking sector that is friendly to big companies, thanks to implicit government guarantees much complained about by rivals elsewhere.

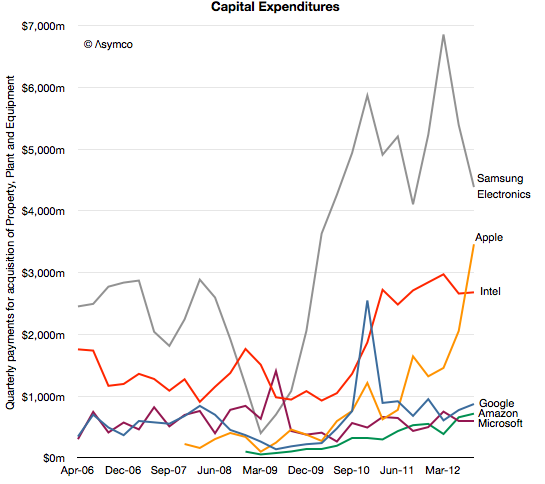
Can we find evidence of this capital intensity?

To answer, I reviewed Samsung Electronics CapEx as reported in their quarterly cash flow statements. The following graph illustrates the data:
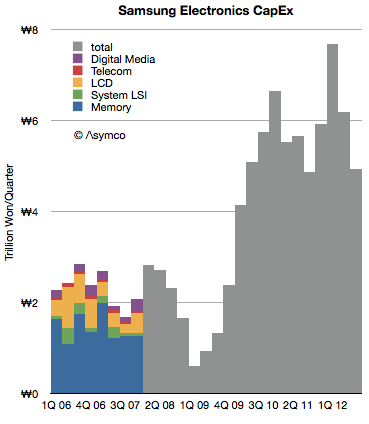
Note that during 2006 and 2007 the company specified expenditures on an operating divisional level. Since 2008 it has reported only a total. For the years where divisional detail is available, the percent split looks as follows. Continue reading “Samsung's Capital Structure”

The real threat that Samsung poses to Apple

[The following is a post written by James Allworth.

James is the co-author of How Will You Measure Your Life?. He has worked as a Fellow at the Forum for Growth and Innovation at Harvard Business School, at Apple, and Booz & Company. It follows and builds on a discussion we had on the 56th Critical Path podcast.

You can connect directly with James on Twitter at @jamesallworth -ed]

A lot of ink has been spilled in the wake of the recent Apple Samsung patent disputes, and the legal wars see no sign of abating any time soon. The rise of Samsung’s phone business has been meteoric, and Apple is right to be concerned. But the real threat that Samsung poses to Apple has very little to do with the copying (or not) of Apple’s designs. The lawsuits have simply been a convenient (if expensive and risky) way to attempt to quash a threat that is of Apple’s own making. While there’s no doubt that Google has played a key role in Samsung’s success by handing out a free mobile operating system to pretty much anyone who wants to build one — it is actually Apple, more than any other company, that is responsible for Samsung’s present success.

How? By outsourcing as much work to Samsung as they have. And it’s impossible not to wonder whether Tim Cook’s announcement yesterday on bringing back Apple’s manufacturing to the USA is the beginnings of an attempt to rectify the problem. Continue reading “The real threat that Samsung poses to Apple”

Apple's new factories

Two years ago, almost to the day, I wrote a post titled It’s time for Apple to look at owning factories again.

What I argued then was that of the problems that Apple had the means to fix, production was what most needed fixing.

Since then we’ve seen evidence of significant investment in manufacturing tooling, where Apple is effectively purchasing the means of production rather than just renting or contracting it out. This capital equipment investment is the equivalent of owning one of the three asset classes that make up a manufacturing operation:

  1. Tooling or capital equipment. The “Capital” at the root of the concept of “Capitalism”.
  2. Skills, talent and knowledge. This is the softer kind of asset that turns out to be harder to replace or buy.
  3. Labor pool. Although considered a commodity even unskilled labor is difficult to obtain if flexible employment is needed in a regulated environment.

It did not stop there. It has also used capital to ensure capacity through pre-orders thereby allowing the skills and labor to be more predictably applied by its suppliers (and preventing competitors from having sufficient supplies). Apple has also taken control of chip design for the vast majority of its CPUs thus building a more bespoke supplier chain.

However these are not enough steps to make production “good enough” to meet the demands of a billion customers buying a new product every other year. Continue reading “Apple's new factories”

Does S stand for Spring?

John Sculley:

“I think they’re going through a very significant change now in terms of product cycles,” Sculley explains. “Traditionally Apple introduces products once a year; now it’s really introducing products twice a year. The complexity of that from a supply chain is immense, and Apple seems to be doing it well. So, I think that people are underestimating just how well Apple is run, and just how successful the company can be when it gets to that twice-a-year product introduction cycle.”

Former Apple CEO John Sculley: Apple is well-run | TUAW – The Unofficial Apple Weblog

Suggesting that Apple is moving to a semi-annual cycle is a very provocative thing to say, but it’s something I’ve also speculated is happening during a Critical Path podcast.  Sculley’s comments prompted me to weigh the possible evidence that this is happening:

  1. All of the major products which Apple sells have been updated in the Fall. This is unprecedented. Not only were product launches scheduled in the spring, historically they had been spread throughout the year. The odds that they happen to coincide by accident are nil. Not only that but the move of iPad and iPhone and iPod and MacBook and iMac to launch all within Fall (once a year) seems risky because it leaves a vast gap for competitors to fill six months hence. Indeed, given the iPhone’s launch predictability, many (most?) competing products already target launching in the Spring.
  2. Launch ramp for iPhone steeper than ever. The number of countries and operators launching the product in the launch quarter is nearly the entire distribution list. This is also the first time this has happened. Not only does it imply a very steep ramp, it indicates no channel fill will be happening past Q1. There will not be incremental sales to unserved customers as the fiscal year wears on.  Continue reading “Does S stand for Spring?”

The mystery of Samsung Electronics SG&A

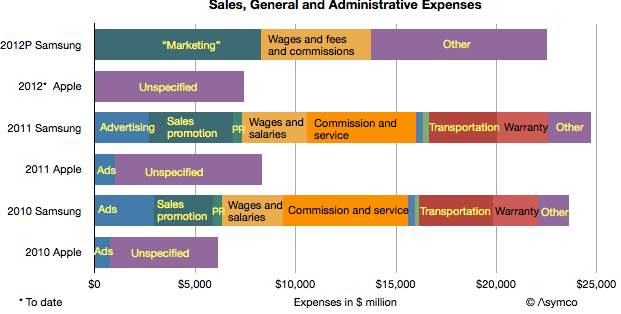
Samsung Electronics’ SG&A expenses are curiously high. Consider the following graph:

It shows SG&A as reported by Samsung and Apple over the periods 2010, 2011 and the sum of the first three calendar quarters of 2012. Note that Samsung appears to be spending three times as much as Apple on sales and administration.

The company offers a break-down of these SG&A costs and they are also shown (Apple does not provide a break-down except for advertising in its yearly report). The suspicion that something is not right comes from looking not only at the overall picture but the notion that Transportation, Warranty and “Other” for Samsung are higher than overall SG&A for Apple. Continue reading “The mystery of Samsung Electronics SG&A”

Asymconf Program

9:00 to 10:15 Being Back. How California came to disrupt

The disruptive history of California is remarkable. Whereas few nations can claim credit to one, California is home to at least four major disruptions: Semiconductors, recorded entertainment, venture capital and personal computing. And it did all this in less than one century. If any one place can vie for the title of “serial disruptor” it’s California. One success can be seen as luck, but many successes imply a system is at work. In this case session we discuss California’s disruptive history and put forward hypotheses on the what causal mechanisms are at work. We ask further whether California can still be the home of future disruptions or whether the system has broken down.

  • The effect of “frontier mentality” on unforeseen growth
  • The effect of migration and diaspora on innovation and counter-effect of the absence of either.
  • Applying these causal themes to the management of innovation in institutions

10:15 to 10:30 Break

10:30 to 12:00 Designed in California, Assembled in China

Geographically and culturally, California is closer to Asia than any other western market. It has always faced west more than it has faced east. Is there a symbiosis between California and Asia? Are its institutions adapting to a new center of economic mass? Is California leading in thinking or culture or is it being disrupted by a new frontier as growth moves east?

  • The growth in Asia and China in particular is in many ways a reflection of rapid industrialization. But it can also be seen as a low-end disruption.
  • What can be learned about business model innovation in the contrast between Californian and Asian approaches to business?
  • Does culture play a part in an innovation mentality?

12:00 to 1:00 Lunch

1:00 to 2:15 Guest presentations and Panel session

Guests are invited to debate or discuss points raised during the morning sessions. A chance for panelists to challenge or refute points made as well as for the provision of anecdotal evidence.

Potential panelists:

  • Ben Bajarin
  • Michael Lopp (aka @Rands)
  • Jean-Louis Gassée
  • Om Malik
  • Charlie Kindel
  • Dan Benjamin
  • Philip Elmer-DeWitt
  • Tim Bradshaw

2:15 to 2:30 Break

2:30 to 4:00 North vs. South

Does the tension between industries of Northern California and Southern California reflect an opportunity or a crisis? We will re-visit the narrative of what Entertainment is hired to do. We will review the differences and similarities of the technological creative process vs. the artistic creative process. We will see whether industrialized, commercialized art is subject to disruptive forces or whether there is persistent exceptionalism at work.

  • Is the intersection of “liberal arts” and “engineering” more than a metaphor?
  • What can be learned by cross-pollination of the creative processes of engineers and artists.
  • What’s the future of technology-based entertainment? Are North and South closer and have more in common than the war talk lets on?

4:00 to 6:00 Reception

Please register here.

Samsung Electronics Segment Revenues and Operating Income in Context

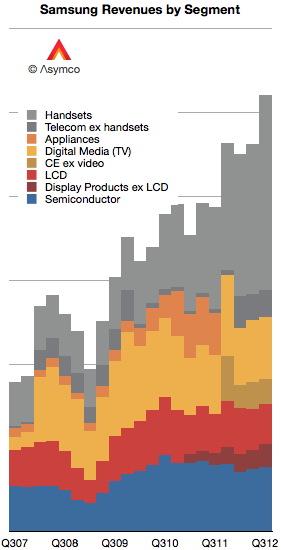
As first introduced last week, Samsung’s revenues have grown primarily due to the expanding volumes of smartphones. In today’s post I convert the revenues and operating incomes to US Dollars and compare them to a set of companies.

First, I should note that Samsung has changed both the designation of its divisions and the way it reports revenue. Broadly speaking, Samsung Electronics has four major divisions:

  1. Semiconductors. This includes memory products as well as systems such as CPUs.
  2. Display products. This used to be called “LCD” but has been re-named Display Products.
  3. Telecom. This is mainly mobile phones but includes additional products and services for telecom operators and PCs. The division has recently been re-named IM (IT and Mobile communications).
  4. Consumer Electronics. This group has changed names from Digital Media and Appliances to CE. The majority of sales value comes from televisions but also includes consumer electronics and appliances.

The company further combines Semiconductors and Display Products into a group called DS (Device Solutions) and Consumer Electronics and IM into DMC (Digital Media & Communications).

I tried to reconcile these various nomenclatures with color coding in the following graph. Semiconductors are blue, Display components are red, Consumer Electronics are Yellow and Mobile are grey.

Each gridline represents $10 billion.

Continue reading “Samsung Electronics Segment Revenues and Operating Income in Context”

The cost of selling Galaxies

In the post “Google vs. Samsung” I compared the profits of Google and Samsung Electronics’ mobile (aka Telecoms) division. It showed how Samsung has grown its mobile business to such a degree that, if sustained, could conceivably influence the way Android is controlled.

However, we should not analyze Samsung’s mobile group in isolation of the entire company. Samsung relies on internal transfer of technology and capacities of production which are quite unique for device vendors today. In other words, Samsung is a relatively integrated enterprise. Understanding the whole is necessary before understanding the part.

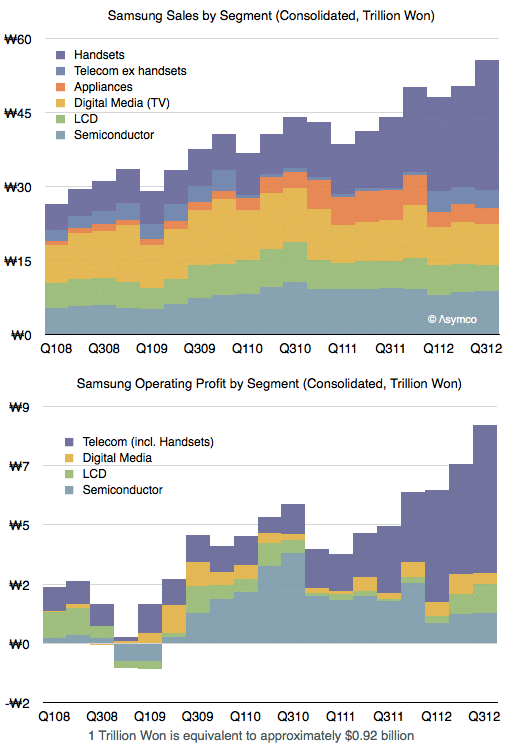
The following graph shows the sales and operating profit for  Samsung Electronics as a composite of its divisions since early 2008.

As one would expect, the mobile group (Telecom) is the source of both top and bottom line growth. The group has also been leading in terms of margins and increasing those margins steadily.  Continue reading “The cost of selling Galaxies”

5by5 | The Critical Path #65: The Shoe Seller's Dilemma

An update on Asymconf California, a discussion of engagement and why Android does not get enough of it, why Amazon likes giving away Fires and the causal hypothesis of Samsung’s success in smartphones. That plus announcing a new 5by5 show: High Density.

via 5by5 | The Critical Path #65: The Shoe Seller’s Dilemma.

Asymco

Asymmetric Competition

Skip to content ↓