Validating the Android engagement paradox

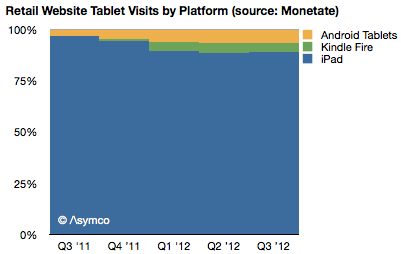
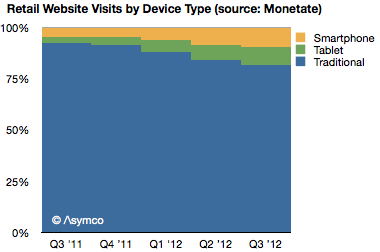
Following yesterday’s IBM data, Monetate released a new study showing similar data related to retail browsing but covering a period of dates from Q3 2011 to Q3 2012.

This data also shows an acceleration of mobile shopping, from 7.7% of online in Q3 2011 to 18.8% in Q3 2012.

It also shows tablets growing to take about half of mobile traffic in a very short time frame.

The data also shows the iPad taking the vast bulk of traffic among tablets (88.9% vs. 88.3% from IBM). Continue reading “Validating the Android engagement paradox”

The Android engagement paradox

IBM’s Digital Analytics Benchmark reported US Black Friday sales and the news is reasonably good. Overall online sales grew by 17.4% while mobile grew to make up 24% of traffic.

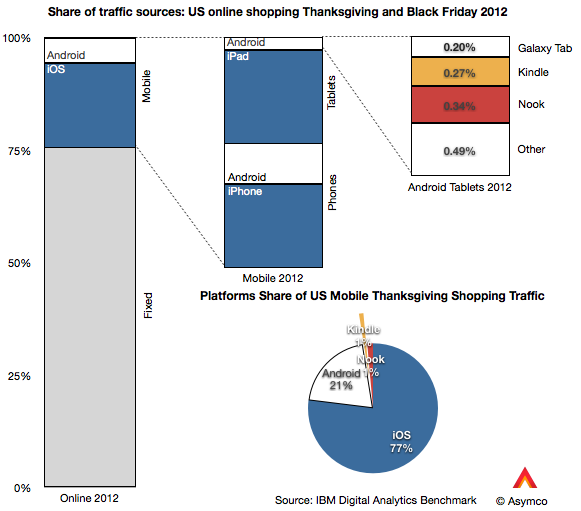
The data goes further to show the split between device types. I illustrate this split with the following graphs:

Of the 24% of traffic made up by mobile devices, phones contributed 13% and tablets 11% (or 54% and 46% of mobile respectively). Of the phone traffic, iOS devices were about two thirds of traffic and Android one third. Of tablet traffic, iPad was 88%, Kindle and Nook were 5.5% Galaxy Tab was 1.8% and other tablets were 4.4%.

Overall, iOS was 77% generated mobile traffic and Android (excl. Kindle, Nook) was 23%.

That’s an interesting snapshot of the consumption of mobile devices, but is there a pattern here? Continue reading “The Android engagement paradox”

5by5 | The Critical Path #64: Mano a Mano

A dialogue with Benedict Evans, mobile analyst. Benedict has observed not only the technology and telecommunications industries as an equities analyst but also worked for an operator and a major media company. We take a look at mobile strategy and what the media industry will evolve into.

via 5by5 | The Critical Path #64: Mano a Mano.

The iPhone Addressable Market

The iPhone is a severely constrained product. We’re used to thinking that it’s production constrained—and it is, but it’s also distribution constrained. It has a business model that is almost completely dependent on operator subsidy. Few end users pay the $650 average price that Apple obtains and that price point has held for a remarkably long time. This price point is largely invisible to the user.

In this regard it’s very different from all the other products Apple sells. Historically, the company has preferred having its customers to also be its users and maintained a direct relationship with them, strengthening that relationship through its own retail channel for the last decade. Pricing is used by Apple as a signal to clearly illustrate value to the user and pricing is part of the communication about the product that Apple makes very explicit. This has been true for the iPod and Mac and is still true of the iPad. But this is not so for the iPhone. The entire marketing strategy for the iPhone (and hence the entire product concept itself) is “off message”.

Why is this?

Continue reading “The iPhone Addressable Market”

The cost of mobile clicks

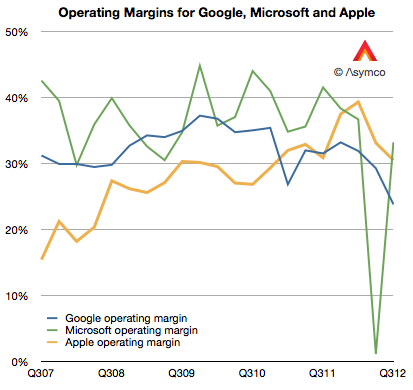
Google’s operating margins fell to 23.7% last quarter. This level is the lowest I’m aware of. From 2007 to late 2009 margin went from about 31% to about 37%.  Then from early 2010 until present they fell. The history is shown the the following graph.

[I included Microsoft and Apple operating margins for comparison.]

Some of the recent decline is due to the inclusion of Motorola into consolidated earnings. Motorola gross margins were therefore 18%. Excluding Motorola, Google gross margins (Revenues-Cost of Revenues) were 61.5% of revenues.  However, even excluding Motorola, Google’s core margins dropped. Continue reading “The cost of mobile clicks”

5by5 | The Critical Path #63: In Orbit

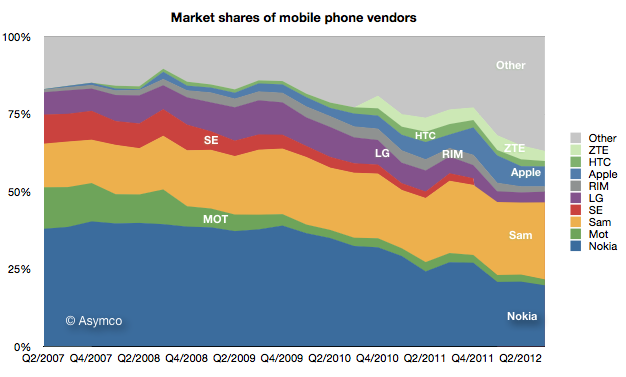
Horace and Moisés talk about the consequences of Samsung’s absorption of all Android profits, the limits of iPhone’s addressable market, Apple bear markets and, like an object in orbit, how Apple seems to always be falling but never hits Earth. Finally, Horace introduces Asymconf California.

via 5by5 | The Critical Path #63: In Orbit.

Asymconf California

Asymconf California is the second[1] in the series and will expand in scope and intensity relative to the first event in Amsterdam. Attendees will be treated to an engaging, participatory experience. Using the case method to teach (and learn), we will look at the state, history and future of innovation as seen from a Californian perspective.

There will be four themes:

  • Being Back. How California came to disrupt and be disrupted.
  • It’s always sunny. Californians invented the concept of lifestyle. Did they also invent the concept of business style?
  • Going West. The role of frontiers (geographic, conceptual and societal) in the creation of wealth. Escaping the zero-sum trap.
  • North vs. South (California.) A modern civil war.

Distinguished guests will be invited to act as presenters and panel members.

Asymconf California will take place January 30, 2013[2] at the IBM Almaden Research Center near San Jose, California.

Two workshops are also planned. Read more and register at asymconf.com.

  1. You can purchase the proceedings from Asymconf Amsterdam.
  2. The day before Macworld/iWorld in San Francisco. Transportation will be arranged from SF.

On not being boring: A dramatic reading of Apple's share price

Apple’s renaissance began with the iPod. This was not evident right away however. The product was unveiled on October 23, 2001 at a time when Apple’s share price had just fallen 70% from year-earlier levels. It was perhaps a good point from which one could expect a recovery to begin.

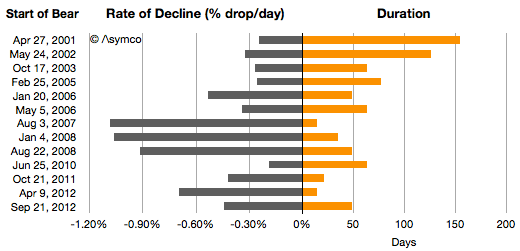
It was not to be. One year after the iPod’s launch the stock price had fallen another 20%. Indeed during 2001 the company was in the throes of a “bear market” in its shares. If we measure a time of persistent share price reduction as a bear market, then the one in 2001 was significant. For 154 days, between April 27 and September 28, 2001 the shares fell 38%. This represents the first bar in the following graph showing all the Apple bear markets since then.

I also illustrated these bear markets in terms of their duration and the average %drop/day.

Chronicling these periods: Continue reading “On not being boring: A dramatic reading of Apple's share price”

Minding the store

Apple’s Retail head was recently replaced. The hire seems to have been a mistake dealt with quite swiftly. It is tempting to think that the firing of a manager is due to a failure in their performance, measurable in quarterly reported metrics. But this is not often the case. It may be true of sales or some operations, but most strategic management decisions take months to make and years to implement before you can have the luxury of measured results. And even then the dependencies of performance are many and outside the control of specific managers.

John Browett joined Apple in April and left in October. A mere six months. How did Apple retail perform in those two quarters? Very well actually. Which is to say, as well as it has previously given the overall performance of the company. The correlation can be shown between store revenues and iOS device shipments:
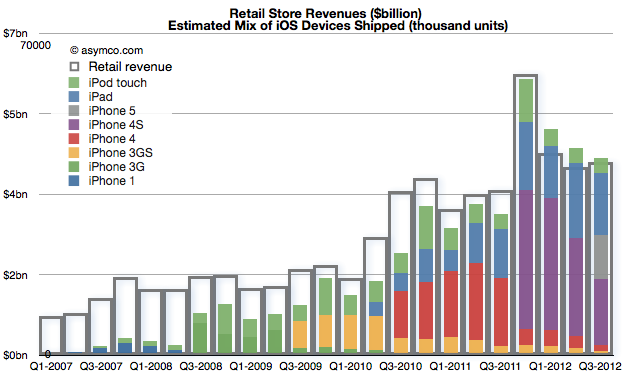
Store visits increased to 94 million in Q3, second only to fourth quarter of 2011. The growth was 21%. Year-on-year growth in revenues was about 17% for both quarters, in-line with company growth. Profits grew 5% in Q2 and 25% in Q3.

Average visitors per employee picked up slightly but remained largely unchanged since 2008. Continue reading “Minding the store”

Asymco

Asymmetric Competition

Skip to content ↓