Why was Wall Street surprised by Apple's performance?

The Earth’s axis is tilted relative to the orbital plane it follows around the Sun. The angle is about 23.44 degrees. Because of this axial tilt, the intensity of sunlight incident on the northern and southern hemispheres varies alternatively throughout the orbit, which, by its duration, is called a “year”. This change in sunlight intensity causes weather changes. Colder when there is less light, warmer when there is more light. Life on Earth became used to this cycle and humans came to call these changes in weather “seasons”.

The warm seasons became the easier seasons for people, especially when agriculture was introduced, since that was when food grew.  Because of the geography of landmasses on Earth, humans became more concentrated in the northern hemisphere. As the northern hemisphere turned away from the Sun darkness and cold returned every year. When that darkness was at its worst people decided it was time to celebrate the return of warmth and sunshine, and thus plentiful food.

So it became very common in northern lands to celebrate the winter solstice or the darkest and coldest time of the year. The amazing thing was that all peoples did this regardless of culture or geographic location. In fact, it became common to mark the end of year at around the same time as the solstice. A new year was said to begin when the Sun began to move higher in the sky every day. The Europeans celebrated the solstice with a festival which eventually came to be called Christmas and the Chinese celebrated it as a Winter Festival which came to be called Chinese New Year.

As part of these celebrations, gift giving also became the default practice. And so, around what came to be called “December” and “January” most of the people in the Northern Hemisphere gave gifts to each other. Interestingly, as people migrated to the southern hemisphere they kept the same festival schedule so that gifting was done in what was the height of summer!

What Wall Street seems to have missed is that the gifting season is a global event spanning into January. In other words, buyers of iPhones aren’t concentrated in one part of the planet and they don’t all celebrate one single gifting festival.

The reason lies in the way the Earth is tilted and the way the continents are arranged upon it. So perhaps a better understanding of astronomy and geography would have helped investors make decisions during the past few weeks. I suggest remedial lessons for those who missed this.

5by5 | The Critical Path #35: Joys and Sorrows

A review of Apple’s performance in the first calendar quarter. Covering the iPhone’s predictability, greater China and international opportunity swamping the US opportunity, the iPad surprise and what mobile means to Apple. Dan and Horace ponder what it means for the largest company in the world to also be the fastest growing company in the world. We discuss whether there is a mobile bubble and, as a bonus, Horace predicts the launch timing of the next iPhone.

via 5by5 | The Critical Path #35: Joys and Sorrows.

Covered a lot of ground. Be sure to rate the show on iTunes.

Apple's Growth Scorecard for the first quarter of 2012

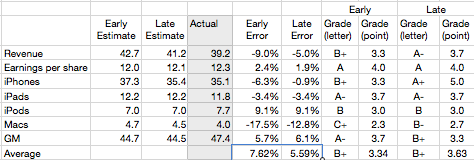
For Apple 2012 started with almost the same growth as 2011 started. Q1 2011 saw earnings growth of 92% and Q1 2012 saw growth of 94%. As the following revenue growth table shows, the pattern for the last twelve months has been very consistent:

Here are some notes: Continue reading “Apple's Growth Scorecard for the first quarter of 2012”

Unforgiven: The consequences of profit failure in mobile phones

In June of last year I wrote a post titled “Does the phone market forgive failure?” It was written on the eve of Nokia’s Q2 2011 report highlighting the historic consequences of a dip into negative operating margins for a phone vendor.

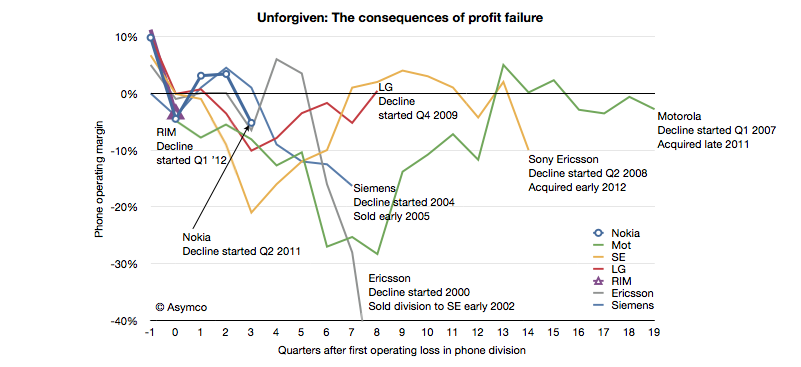
I listed 13 phone vendors who were either merged, liquidated or acquired. There are no examples of vendors who recovered from a position of loss making.

I was prompted to follow-up by a note Charter Equity Research analyst Edward Snyder wrote illustrating the effect of negative operating margins on phone vendors. I took his illustration and expanded it with additional data.

Since my post in June last year Sony Ericsson and Motorola were acquired making the victims list total 14 companies, with Nokia, LG and RIM having joined the “endangered species list”. If the pattern repeats, then RIM and Nokia are in early phases of what promises to be an extended period of pain followed by an exit.

What the analysis does not answer is Continue reading “Unforgiven: The consequences of profit failure in mobile phones”

Google and Microsoft speak volumes with silence

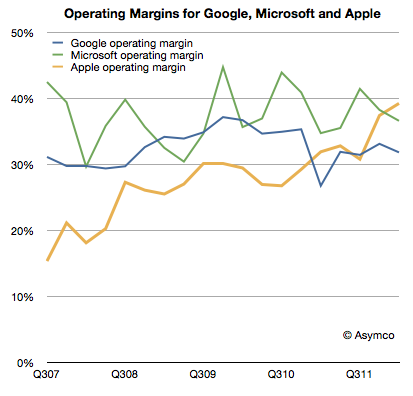
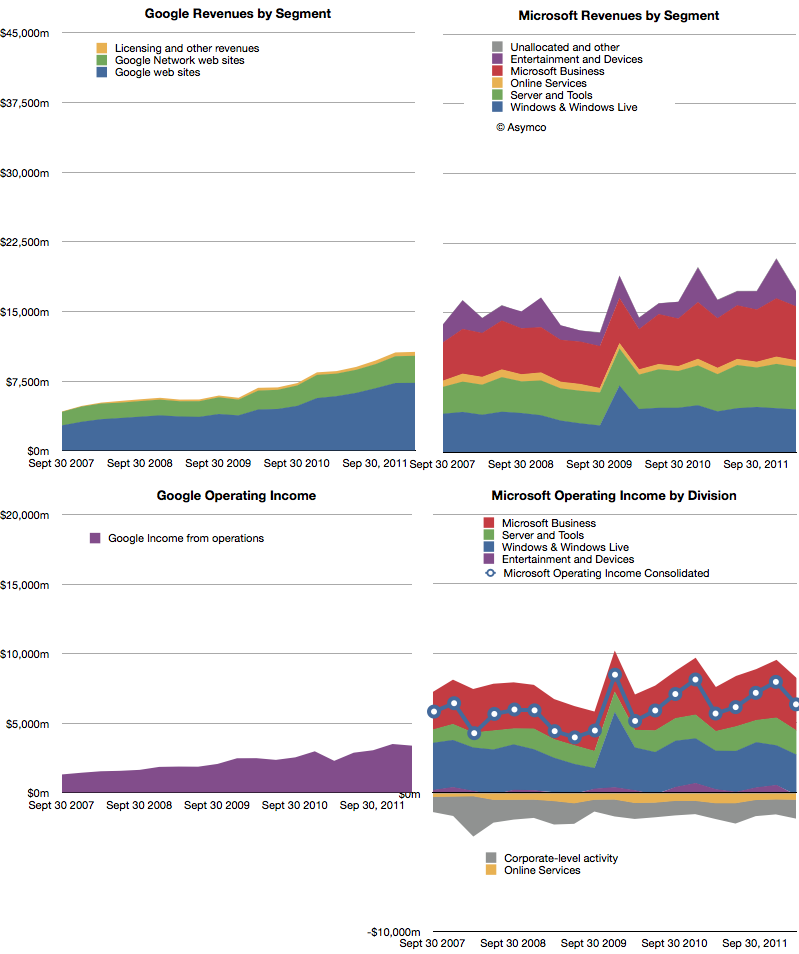
The following charts show Google and Microsoft revenues and operating income:

Both companies showed healthy growth. Revenues: Microsoft 6%, Google 24%. Operating Income: Microsoft 12%, Google 48%. Google had a particularly weak margin Q1 2011 so its income growth appears very strong.

The surprise in Microsoft’s performance was Continue reading “Google and Microsoft speak volumes with silence”

Forecasting Nokia's Windows Phone sales and Microsoft's mobile customer acquisition cost

Our agreement with Microsoft includes platform support payments from Microsoft to us as well as software royalty payments from us to Microsoft. In the first quarter 2012, we received a quarterly platform support payment of USD 250 million (approximately EUR 189 million). We have a competitive software royalty structure, which includes minimum software royalty commitments. Over the life of the agreement, both the platform support payments and the minimum software royalty commitments are expected to measure in the billions of US Dollars. The total amount of the platform support payments is expected to slightly exceed the total amount of the minimum software royalty commitments.

From Nokia’s Q1 2012 financial interim report

The figure of $250 million for Q1 is the same as the amount Nokia received for “platform support” in Q4 2011. This means Microsoft has paid $500 million over two quarters. During the same time frame Nokia shipped approximately three million Windows Phone devices. The average cost to Microsoft to acquire a Nokia Windows Phone user is therefore $167 per user. This is down from $250/user in the last quarter.[1]

If the royalty is equivalent to a license fee then the more interesting question is how and when will the royalty payments nearly match the platform support payments as expected. This might give us an estimate of what both parties are expecting from the relationship. Continue reading “Forecasting Nokia's Windows Phone sales and Microsoft's mobile customer acquisition cost”

Nokia's evaporating brand value

Nokia reported Q1 results following very closely the warning issued last week.

There were few surprises. There is much more detail in terms of regional performance which might be a better indicator of how the smartphone strategy is playing out. I plotted the data in three charts.

Regional Sales Value

A year ago Europe and China were nearly equally valuable as regions to Nokia (€2.1 billion and €1.9 billion, respectively). Even though sales fell across all regions, China fell so much that it has become the fourth in value and nearly the same value as Latin America (€577 million for China vs. €542 million for Latin America). This is a significant reversal for a very important market. The drop in value is a staggering 70%. Is there some clue as to what caused this? Continue reading “Nokia's evaporating brand value”

5by5 | The Critical Path #34: Climax and Anti-climax

Horace and Dan talk about Asymconf 1.0 focusing on the risks taken and rewards obtained. We cover the concept, technical implementation, dynamics and where the show will go from here. Horace describes the fascinating “lost tapes” of Steve Jobs and Nokia’s latest anticlimactic results.

via 5by5 | The Critical Path #34: Climax and Anti-climax.

Show notes:

Apple Stores have seventeen times better performance than the average retailer

Thanks to RetailSails we have some data on retailers in the US which can be used to calibrate the performance of Apple retail. RetailSails compiled a table of the top 20 chains by sales per square foot (annual basis). The total sample was 160 American retailers (excluding restaurants) that publicly report results.

Sales per unit area is a standard and usually the primary measurement of store success. Here are some benchmark figures:

  • Annual store sales in the range of $300 per square foot is considered respectable in the US.
  • The US national average for regional malls is $341.
  • The average for specialty apparel retailers is $400 per square foot.
  • The average for jewelers is in the range of $600 per square foot.
  • The median for the best 20 US retailers is $787/sq. ft.

The data for the top 20 is shown in the following chart:

The data shows Apple leading by a significant margin. It’s more than twice as efficient as the second place Tiffany and Co. It’s also more than seven times the median of the top 20 and seventeen times better than the average mall retail space.

Note also that this data includes only physical retail and excludes e-commerce, catalog or services revenues. It should only be used to compare physical retail performance.


The achievement is also remarkable when measuring growth in overall sales. Continue reading “Apple Stores have seventeen times better performance than the average retailer”

Asymconf 1.0

The first Asymconf was conducted on Friday, April 13th, 2012 in Amsterdam. Here are some statistics from the show:

  1. 155 registered participants and over 1000 participation hours
  2. Over 500 tweets generated during the day (#asymconf)
  3. Eight hours of conference executed on schedule
  4. Three iPads used to facilitate: one as a whiteboard, one as a slide presenter and one as an interactive motion chart.
  5. Seven video cameras used to capture over 1 terabyte of video data.
  6. Four cases conducted with majority of time spent on audience participation

Overall, feedback has been very positive. We will now edit the video to make it available for download. We will also analyze all aspects of the event to understand how it can be improved and post our findings.

We plan to hold Asymconf 2.0 in approximately six months somewhere on the West Coast of the US. We are already scouting for locations.

If you have photos or additional comments regarding the event that you’d like to share, please post them below.

My thanks to those who made Asymconf possible:


Asymco

Asymmetric Competition

Skip to content ↓