How Samsung beat Nokia

Nokia currently estimates that Devices & Services net sales in the first quarter 2012 were EUR 4.2 billion, comprised of Mobile Phones net sales of EUR 2.3 billion (71 million units), Smart Devices net sales of EUR 1.7 billion (12 million units),

via Nokia lowers Devices & Services first quarter 2012 outlook and provides second quarter 2012 outlook » Nokia – Press.

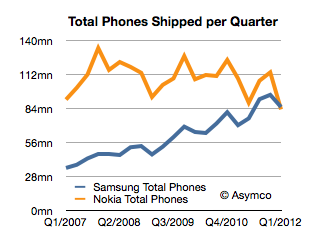
We don’t have the total number of Samsung shipments, however estimates exist. They range between 41 and 44 million smartphones and 44 and 47 million feature phones. The low end of that range would imply Samsung shipped 85 million phones.

Nokia’s press release indicates that it shipped 83 million.

This would be the first quarter that Samsung beat Nokia in total phone shipments. It had already overtaken Nokia in sales volume and profitability last year but this is the most cited metric of market performance: being the biggest in volume. Here is the tale of the shipments:

How did this happen? Continue reading “How Samsung beat Nokia”

5by5 | The Critical Path #33: The Futility of Machinations

Dan and Horace are back to discuss the latest news from Nokia, RIM, HTC and Sony and what they have to do with each other. We touch on the distinction between market and product orientation and meander into the question of what is the value of the enterprise vis-a-vis the product it sells and what management has meant and what it should mean. We even tackle the history (and future) of history.

via 5by5 | The Critical Path #33: The Futility of Machinations.

This show covered a lot of topics, broad as well as deep.

Show notes and links:

  1. Investors hang up on Nokia after yet another profit warning – Apr. 11, 2012
  2. Sony posts its worst loss ever – USATODAY.com
  3. Sony doubles red ink forecast to worst loss ever – Yahoo! Finance
  4. Sony and Sharp warn of record annual losses – Telegraph
  5. 5by5 | The Critical Path #2: Synchronized failure

When will smartphones reach saturation in the US?

Nielsen has already noted that more than half of US consumers have smartphones. comScore’s data seems to point to that threshold being crossed sometime this year.

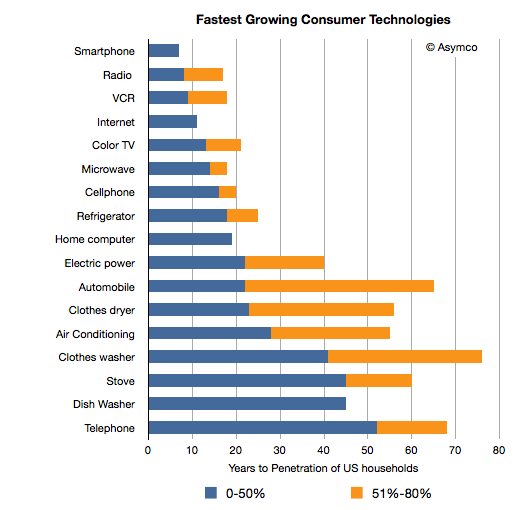
If that point is crossed then it would mark the smartphone as one of the most rapidly adopted consumer technologies of all time. I plotted the time it took for a set of technologies to reach 50% penetration of US households.

I also showed the time it took for some of the technologies to reach 80% penetration.  Continue reading “When will smartphones reach saturation in the US?”

Did the dividend decision affect Apple's share price?

One of the arguments made for the cause of the increase in Apple’s share price of late has been that dividends would attract more institutional investors and provide more liquidity to Apple’s shares. Can we test this argument?

We’re not dealing with speculation. The decision to start paying dividends was made three weeks ago. It makes sense to assume that this new information has been absorbed by the  markets and market participants have adjusted their positions. Funds that were previously restricted in their investment in Apple due to its lack of dividend policy, could now go ahead.

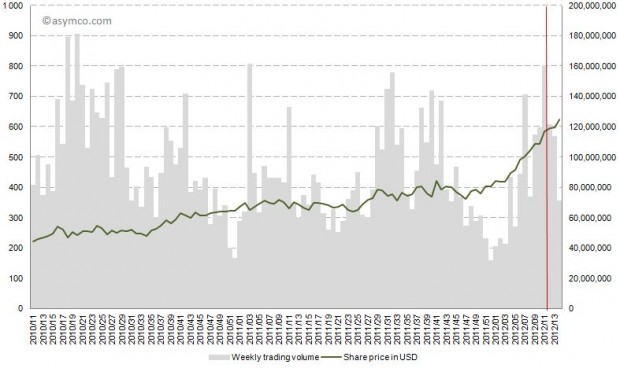
However, as the following chart shows, the share price climbed continuously before and after the dividend declaration of March 19th (shown in red). Trading patterns did not show unusual highs or lows. In fact, after March 19th the trading volume decreased on a weekly basis.

The other indicator is institutional holdings. Continue reading “Did the dividend decision affect Apple's share price?”

Take the money and run

In August 2007, during the HD format wars between HD-DVD and Blu-ray format, Toshiba offered Paramount and Dreamworks $150 million to produce HD versions of their movies exclusively as HD-DVD.[1]

This type of deal is equivalent to an “advance” offered to a book author. The DVD manufacturer pays studios up-front cash for the right to make its DVDs. From an accounting point of view this is treated as an advance that the manufacturer recovers by selling the DVDs back to the studio’s video division in the same way a publisher earns back the advance it gives an author.

In this case, the payment was so large and the sales of HD-DVDs so small that Toshiba was unlikely to earn back the entire advance. The way the deal made any sense for Toshiba was that it was exclusive: the studios could not continue to release their movies in Blu-ray. The deal was done explicitly to hobble a competitor and create “critical mass” of content for its own format.

But then in March 2008, Toshiba threw in the towel and abandoned the HD-DVD format. The way the deal worked, the studios got to keep almost all of the $150 million. They then re-released all their movies in the Blu-ray format. The only “cost” to the $150 million windfall was that there was a nine month delay in the eventual release to Blu-ray–a small price to pay for an emergent format without a large install base.[2]

Platform owners go to great lengths to ensure “content” for their platform. They will, essentially, finance an ecosystem when there are barriers to entry or when competing ecosystems are far more lucrative.

This scenario for movies is being played again with Netflix, Hulu and other distributors who need to fill their pipelines. Netflix’s content acquisition costs are exploding and putting the whole company’s future in doubt.

But this scenario is also being played out with app developers. Most recently, news broke that developers are receiving payments from Microsoft for Windows Phone ports of popular apps. In mobile platforms, apps are the new content and developers are the new studios.  It’s also a practice that is not without precedent[3].

This is as it should be. The value of the platform lies mainly in what is built on top of it just like a foundation is not much use without a house on it. However, the practice of “priming the pump” with cash payments for porting is not ideal. Like spiffs, those who receive payments may become used to it and withhold development if there is no payment. Also, those who did not get payment offers may feel shunned and retaliate in kind. Those who receive payment may become cynical about it and may not put in the extra effort (or, more probably, outsource) to make the work spectacular.

Or, like Paramount, they may just take the money and run if/when the platform fails.

Notes:

  1. Source: The Hollywood Economist 2.0: The Hidden Financial Reality Behind the Movies by Edward Jay Epstein.
  2. Paramount made $250 million more from three “replication output” deals: $50 million from Toshiba for agreeing to release Titanic on DVD in time for Christmas sales, $150 million from Panasonic for agreeing to allow them to take over video replication from Thompson, and $50 million from the law firm Ziffrin, Brittenham and Circuit City stores for agreeing to support the DIVX format. Paramount got to keep the money even though DIVX never launched.
  3. Although it’s never been reported that Apple pays developers for building iOS apps, some developers do benefit from promotional placement and visibility during launch events and from early access to devices or SDKs under development.

Half of US iPhones are repeat purchases

Canaccord Genuity analyst Mike Walkley writes in a note to clients today. “In fact, we believe iPhones are outselling all other smartphones combined at Sprint and AT&T and selling at roughly equal volume to all Android smartphones at Verizon.”

via iPhone Tops Sales Charts at Each of Its U.S. Carriers – John Paczkowski – Mobile – AllThingsD.

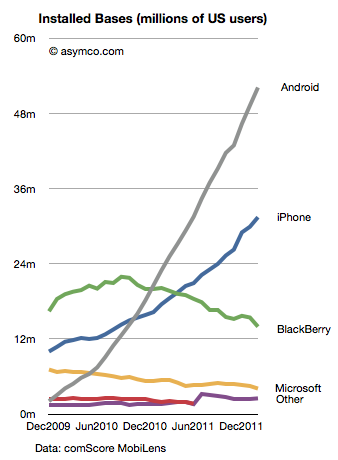
That’s useful data. Mainly because we can use it in combination with comScore data that tracks a different market measure. comScore’s MobiLens service tracks US mobile installed base. By measuring the difference between their stats one month to the next, one can measure the gain in a particular platform.

Comparing that gain with the sell-through rate in the same period can yield a figure for the number of units sold as upgrades vs. those sold to new users. Continue reading “Half of US iPhones are repeat purchases”

5by5 | The Critical Path #32: Mockumentary

Horace talks again with Dan Abrams about film budgeting, Kickstarter, pre-production, location, technology for production, and a surprise announcement. We also discuss the project-oriented nature of movie production vis-a-vis “pipelined” product development, the history of studios and how they evolved, Pixar and much. much more.

via 5by5 | The Critical Path #32: Mockumentary.

Show Notes and Links:

  1. Roger Corman blog post
  2. The False Profit Kickstarter page
  3. Discussion of the film by Bill Torgerson, another CP guest
  4. Steven Bach and the history of United Artists “Final Cut”
  5. Steven Bach on Wikipedia
  6. Technology drivers for the Impressionist era

This was quite a fun show.

Weighing the share of value created

Philip Elmer-Dewitt published a table from Piper Jaffray’s Gene Munster which has some interesting details. Munster has taken a four year “tech sector” view of value creation (and destruction) and tried to see if there is a bound on the value Apple can continue to capture. This “share of value” is one of many approaches to bounding an opportunity. You could consider “share of wallet” by measuring disposable income, or “share of eyeballs” by measuring screen time available or even “share of GDP”.

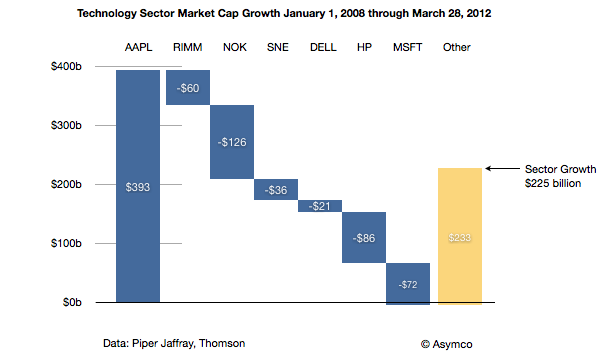
The attractive part of the share of value of industry is that we have an implicit way to see winners and losers, or the transfer of wealth from one group to another. I charted the data published as follows:

Seen in this context, Apple generated nearly as much value[1] as RIM, Nokia, Sony, Dell, HP and Microsoft destroyed. The rest of Continue reading “Weighing the share of value created”

The role of capital [1]

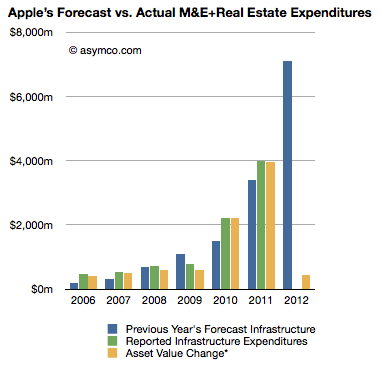
At the end of 2011 Apple’s net property, plant and equipment (PP&E) was $7.8 billion. This reflects $12.34 billion gross PP&E net accumulated depreciation and amortization of $4.5 billion. The depreciation and amortization increased by a total of $533 million and the gross PP&E increased by only $572 million. I say “only” because in the previous quarter PP&E increased by $1.42 billion. If we assume that this growth is equivalent to capital expenditures for the quarter, it’s also a very small amount given the company’s stated intentions to spend $7.1 billion during the fiscal year.

The gap is illustrated in the following chart:

Continue reading “The role of capital [1]”

Asymco

Asymmetric Competition

Skip to content ↓