How much does it cost to manufacture an iPhone?

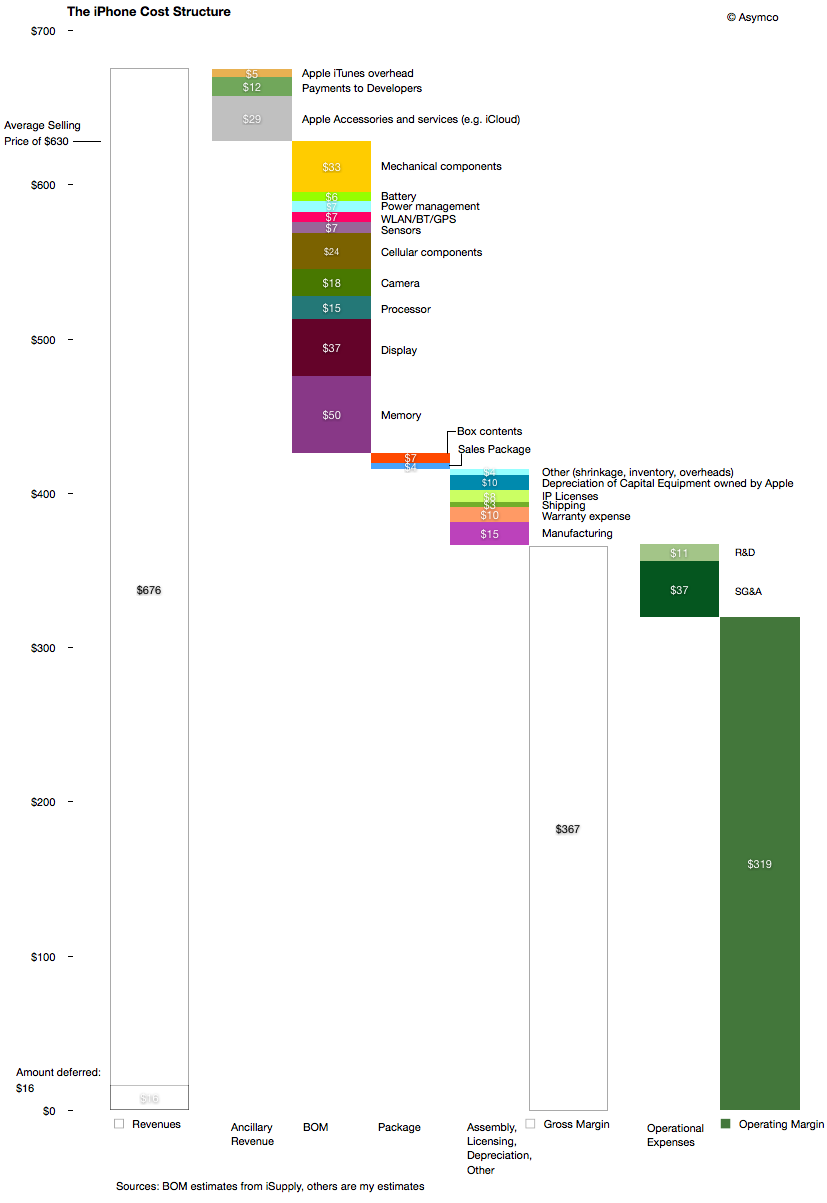
An iPhone generates approximately $650 in revenue for Apple. This figure has remained fairly steady over time. Using deduction from overall margins, it’s possible to estimate the gross margin on the product to be around 55%.

That means that the cost of goods sold (COGS) for the iPhone is about $293. Is that a lot? Where does that money go? What else does it tell us about how the company operates?

To find out we need to understand the cost structure of phone building.

Typically there are four main categories of costs for a phone:

  1. Bill of materials (BOM). This represents the cost of the components that go into the device. These are paid to suppliers.
  2. Transportation/warehousing. This is the cost to transport and store the product before sale. This is paid to shipping companies and warehousing.
  3. Manufacturing cost (including labor). This is paid to contract manufacturers.
  4. Warranty expense. This is paid back to customers for returned product that can no longer be sold.

We can estimate a device’s BOM through a teardown analysis Continue reading “How much does it cost to manufacture an iPhone?”

The opportunity cost of Windows Phone

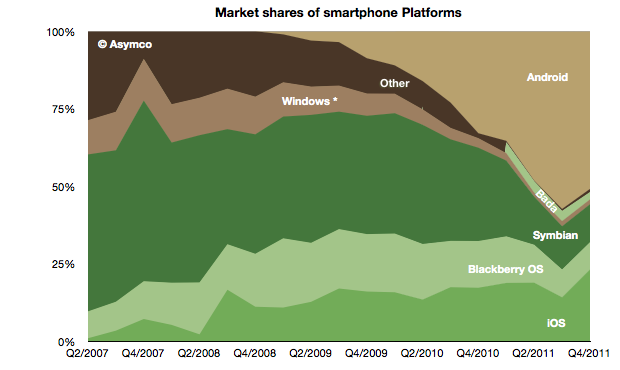
The global mobile OS market shares for Q4 shows a continuing (but diminished) leading share.

At the end of last year Android’s unit share reached 51% which is down from about 57% during the third quarter. iOS reached 23%, followed by Symbian at 12%, RIM at 9%, Bada at 2.4%, Windows Phone at 1.6% and Other at 1%.

When seen on a year/year basis Continue reading “The opportunity cost of Windows Phone”

App developers receive $12 for each iOS device sold

One of the more interesting numbers reported by Tim Cook during the last earnings conference call was the total payment to developers during the fourth quarter. This is the first time that Apple reported a quarterly payout to developers.

The figure was $700 million and it was mentioned in reference to the total payments to date of $4 billion. The $700 million is interesting at least because it gives an idea of what Apple obtained in total sales of Apps. As it retains 30% and pays 70% to developers then it follows that it retained $300 million and the total “gross” sales was $1 billion in Q4.[1]

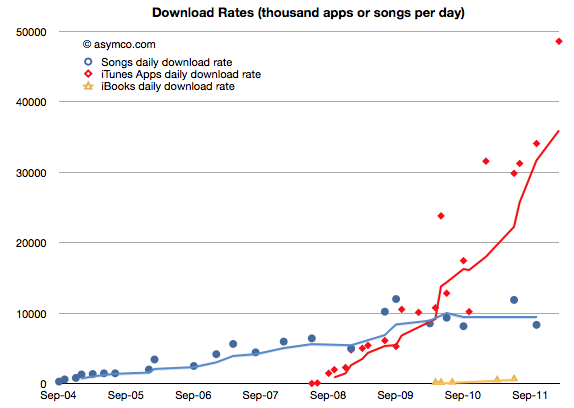
The $700 million is interesting for another reason. The $1 billion in gross income can be tested against another set of data. As the countdown has already started, sometime in February Apple will report 25 billion total apps downloaded. The last such milestone was October 4th when it reported 18 billion downloads. Assuming that they will cross 25 billion by February 25th, then we can obtain an estimate for the download rate per day: about 48.6 million apps/day.

That is a figure we can plot historically:

Continue reading “App developers receive $12 for each iOS device sold”

5by5 | The Critical Path #25: Only the freshest Mountain Dew

We take a look at Mountain Lion as evidence that Apple is cross-pollinating its product lines. We look at the Apple stores as a service brand and Horace tips his hand ever so slightly about Asymconf.

via 5by5 | The Critical Path #25: Only the freshest Mountain Dew.

Apple sold more iOS devices in 2011 than all the Macs it sold in 28 years

Tim Cook on the 55 million iPads sold to date:

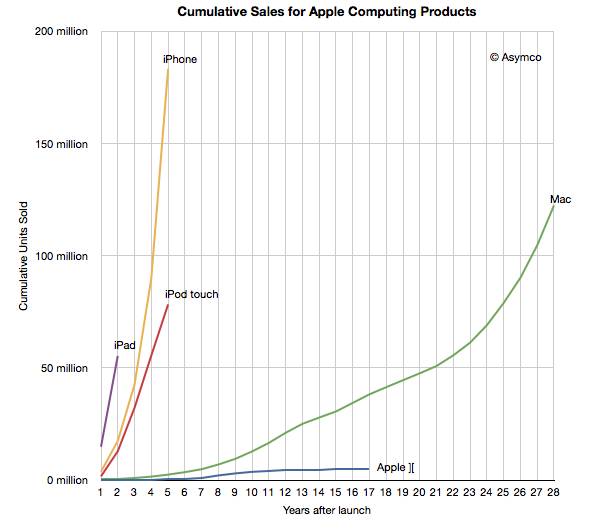
This 55 is something no one would have guessed. Including us. To put it in context, it took us 22 years to sell 55 million Macs. It took us about 5 years to sell 22 million iPods, and it took us about 3 years to sell that many iPhones. And so, this thing is, as you said, it’s on a trajectory that’s off the charts.

via Transcript: Apple CEO Tim Cook at Goldman Sachs – Apple 2.0 – Fortune Tech.

That gave me an idea. Here is a plot of each major computing product Apple sold throughout its history shown as a cumulative total since product launch.

Continue reading “Apple sold more iOS devices in 2011 than all the Macs it sold in 28 years”

The iPhone opportunity: a visual update

In yesterday’s talk Tim Cook described the opportunity he felt Apple faced. To readers of this blog this opportunity has been regularly illustrated, at least on a quarterly basis.  Here is the iPhone opportunity relative to other platforms:

In absolute units by vendor, separated by smart and non-smart phones, the data looks like this: Continue reading “The iPhone opportunity: a visual update”

Tim Cook on the "Law of Large Numbers"

Q: 37 million units of iPhones shipped. When do we run into the Law of Large Numbers? What are the growth opportunities coming up?

A: 37 million is a big number. It was a decent quarter. It was 37 million — more than we’d ever done before. We were pretty happy with that, but let me give you the way I look at the numbers. As I see it, that 37 million for last quarter represented 24% of the smartphone market. There’s 3 out of 4 people buying something else. 9 out of 10 phone buyers are buying something else.

Handset market is projected to go from 1.5 to 2 billion units. Take it in the context of these numbers, the truth is that this is a jaw-dropping industry with enormous opportunity. Up against those numbers, the numbers don’t seem so large anymore. What seems so large to me is the opportunity.

What we’re focusing on is the same thing we’ve always focused on. Making the world’s best products.

We think if we stay laser-focused on that, and continue to develop the ecosystem around the iPhone, that we have a pretty good opportunity to take advantage of this enormous market.

Q: The biggest opportunity is the emerging markets. Large portion of that is the prepaid market. Apple has done very well but the wholesale iPhone price point is nowhere near what we would expect in the prepaid market. How do you make it more affordable to those markets?

A: Continue reading “Tim Cook on the "Law of Large Numbers"”

The world's biggest startup

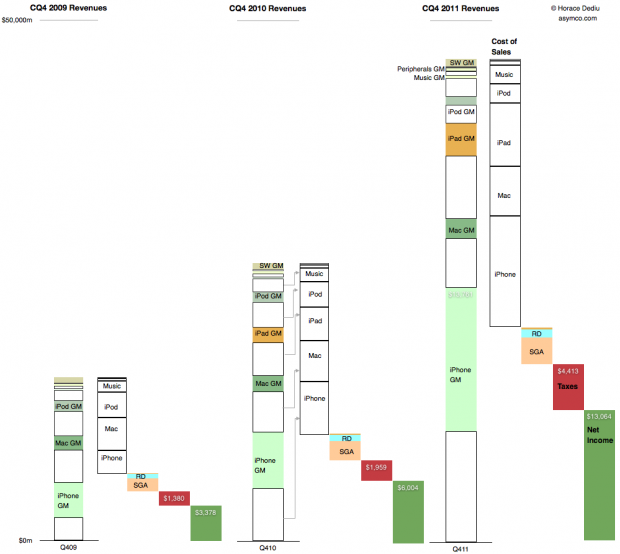
Last year we began offering revenue and operating income comparisons between Apple and Microsoft. It was becoming evident that the iOS franchise was beginning to overtake both in revenue and profitability the Windows franchise. To offer more dimensions of comparison this time I am adding Google’s top and bottom lines for comparison (click image for detail):

Note that the graphs have the same scales when read horizontally. Continue reading “The world's biggest startup”

[Updated] Following up: When will Apple's share price reach $500

Apple’s valuation since October 2008 has been very highly correlated to its cash (R-squared of 0.91). This tight relationship to Apple’s value is shown in the chart below:

(The chart shows weekly, ending each Friday, share price (vertical axis) vs. interpolated weekly cash per share (horizontal axis) assuming linear growth between quarterly announcements. Share price data is current as of last Friday (Feb. 10) though cash per share is based on announcement date and hence delayed by about three weeks.)

I noted this relationship in May 2011 and followed up in September 2011.  With current cash per share reaching $95 to $100 $103.66 it seems that the share price should be around $500 any time now.

Apple retail growth data

Apple’s retail stores increased sales by nearly 60% in Q4. This is a dramatic though not unprecedented change from Q3’s 1% growth rate. The growth rate faithfully tracks iPhone releases as demonstrated in a post last quarter.

When seen on a yearly basis some of the data begin to from a picture.

  • There were 332 million visitors in 2011, an increase of 29%. (This total is greater than the population of the United States.)
  • The average  revenue was nearly $50 million/store
  • 38 stores were opened, in-line with 2010’s 40 openings
  • Total 2011 revenues were $16.4 billion
  • About 34,600 (full time equivalent) employees were employed on average
  • There were nearly 1 million visitors per store
  • There were an average of 100 employees assigned to each store
  • Average revenue/employee was $473,622
  • Average profit/employee was $120,289
  • There were about 9,600 visitors for each employee
  • Each visitor generated about $50 in revenue
  • The revenue per square foot was about $6,500 across all stores.

Some of these metrics are shown in the following charts relative to prior years: Continue reading “Apple retail growth data”

Asymco

Asymmetric Competition

Skip to content ↓