Why Apple is cheap

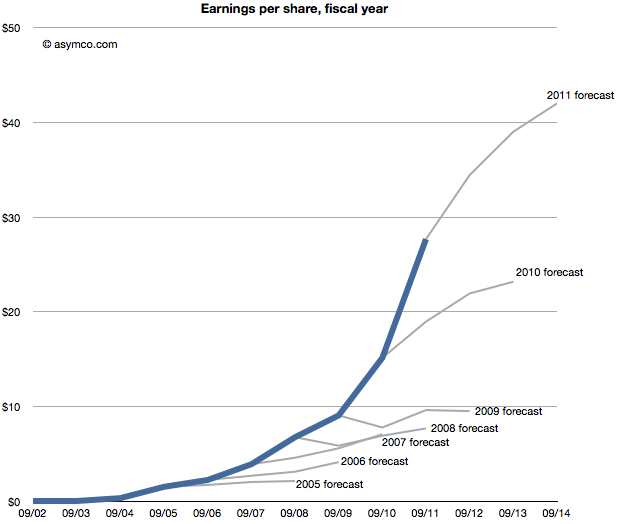
Imagine it’s late 2005. Apple’s fiscal year just ended and they reported their performance. You’re an analyst whose job includes forecasting the company’s performance for next year. This is a weighty responsibility.  Your forecast will be blended with those of your peers and used as a “consensus” average. That consensus for the next year will be used to measure the current value of the shares in a ratio called the forward PEG or Price/Earnings/annual earnings Growth. You are supplying the earnings and hence growth forecast while the market offers a price.  As a stock is meant to measure future earnings, your forecast is a crucial and frequently cited figure about whether a stock is priced fairly.

There is some comfort in knowing that there will be many others who will offer such a forecast and your contribution is thus not the only way investors can calibrate the price. However, you should think hard about what you are predicting as it also will reflect your skill in predicting such a visible company.

Apple just had a tremendous two years. 2004 and 2005 saw EPS grow at 274% and 337%. This is largely due to the runaway hit iPod. Given all that is known about the company, what will you put forward? While you’re at it can you also forecast two years forward, namely provide a growth forecast for 2006, 2007 and 2008?

Here is what you and your cohorts publish as a consensus:
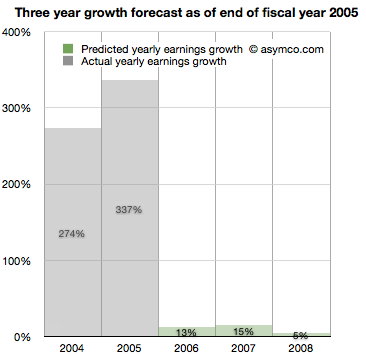
You go with a 13% growth for 2006,  15% for 2007 and 5% for 2008. The chances are, you reason, that the iPod will not carry the company’s growth much longer. The competition is sprouting all over and Microsoft is rumored to be launching its own music player.

It makes sense to be conservative and offer a modest growth of 13%. At the same time you can rate the stock a buy as it is still growing. The stock just doubled in the last 12 months and the law of large numbers says that growth cannot last at the same rate as we’ve just seen.
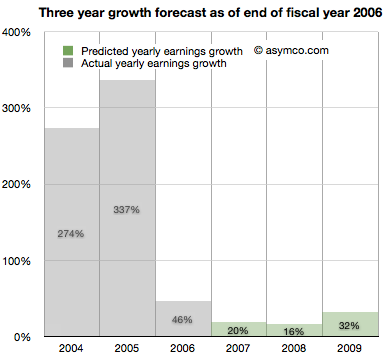


It’s now late 2006. Apple just closed out another big year. Contrary to your forecast last year, the company grew at a rate of 46%, more than three times faster than you expected.

It turns out the iPod still has some legs and the company’s Mac business seems to be growing. Looking forward you take your 15% growth for 2007 and increase it to 20% and suggest 16% for 2008 and 32% for 2009.

There are rumors of Apple getting into the phone business.

Continue reading “Why Apple is cheap”

5by5 | The Critical Path #16: The Existence Proof

Horace interviews Dan Benjamin on the motivation, basis of competition and trajectory of the 5by5 network. By studying where podcasting came from and where it’s going we provide proof of existence of disruption in “big media”.

via 5by5 | The Critical Path #16: The Existence Proof.

Turning the tables in more ways than one.

Global smartphone penetration nearing 10%

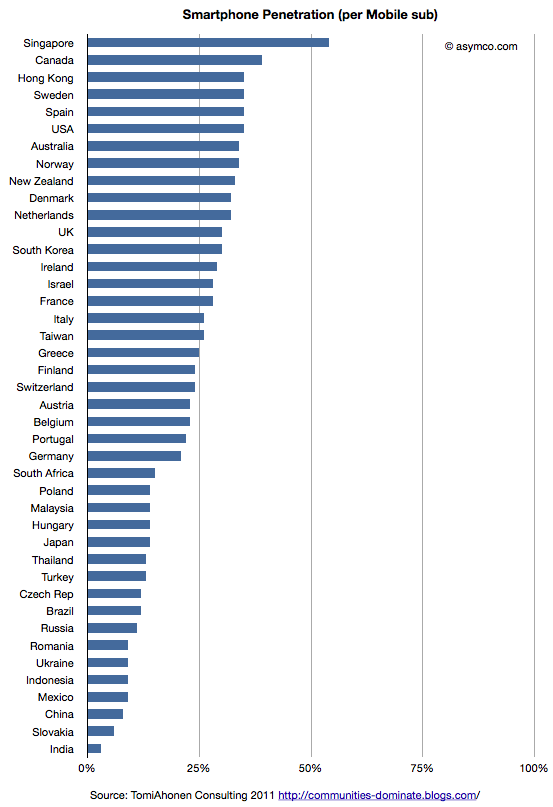
Tomi Ahonen has compiled a fascinating data set on 42 major countries’ smartphone penetration rates. The compilation is based on Netsize Guide, Informa, Google and Ipsos data. It is a complex sample with multiple possible sources of error (read the post for the caveats.) However, this is a breakthrough. It’s the first time I’ve seen this level of detail at a country level in the public domain.

I maintain visualizations of ITU data which shows overall mobile consumption and broadband consumption and penetration. In order to maintain a consistent basis of comparison, I prefer to use ITU’s measure of consumption which is “subscriptions” rather than “population”. The ITU derives this measure because mobile operators think of points of connection (subs) rather than people as the measure of consumption. This makes some sense because connections are what are monetized–not people.

So the first piece of analysis is to show this measure of penetration (smartphones as a percent of subscriptions) for the 42 sampled countries.

This view shows which countries “lead” adoption in terms of penetration. It shows that the US is quite high in the ranking and the most penetrated “large” country.

This is highlighted by the following chart which shows penetration of smartphones vs. total subscriptions with bubble size representing population size. Continue reading “Global smartphone penetration nearing 10%”

5by5 | The Critical Path #15: The Theater of Disruption

With this interview, we begin a journey into the world of entertainment and the forces that are re-shaping what most of the world hires daily for recreation. We will talk to actors, writers, producers, distributors, and media execs. We’ll get perspective on what I expect will be a big year for television in 2012 and prepare for the new era to follow.

In this episode I talk to actor Hoon Lee[1] about the challenges of disruption in the creative arts, and theater in particular.

5by5 | The Critical Path #15: The Theater of Disruption.

  1. Soon to be the voice of Master Splinter on the to-be-re-released Teenage Mutant Ninja Turtles TV series. More about Hoon here: IMDb.
  2. Read more here: Building identity – Hoon Lee: a black sheep because he was artistically inclined

Hiding in plain sight

Guessing the next Apple product has become the parlor game of choice for a whole generation of technology journalists and analysts. The premise of the game is that given a track record of breakthrough products, there is always another one just around the corner. Being the one to predict this next breakthrough product creates credibility and demonstrates the domain knowledge of the predictor. If the prediction fails to materialize there is consolation in dismissing the actual announced product as disappointing, unsophisticated or, worst of all, uninteresting.

Most often, these guesses are as much a reflection of the analyst as they are an analysis of the company. Too many predictions are designed to impress or demonstrate the imagination or knowledge of the predictor. They typically anticipate a giant leap of functionality, power or market re-structuring. They envision revolution not evolution; a cutting of the Gordian knot not a polishing of ugly rocks.

Yet nearly all of Apple’s launches have been sustaining improvements in existing products, technologies or platforms. To name just a few: Continue reading “Hiding in plain sight”

Estimates for Apple's first fiscal 2012 quarter

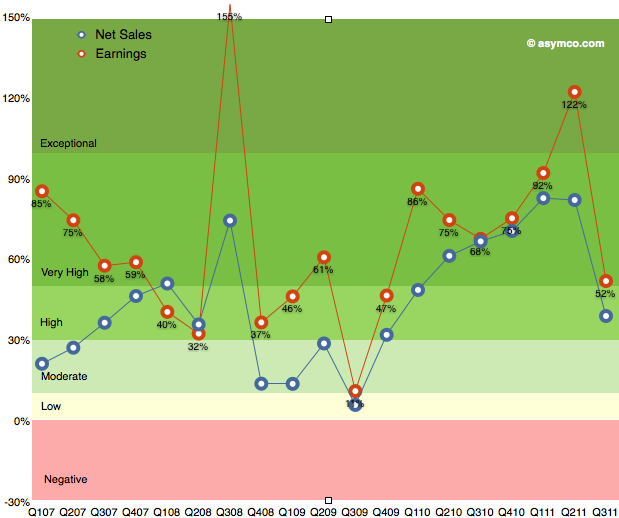
As the chart below shows, the last quarter (third calendar, fourth fiscal 2011) was slow with only 52% earnings growth. The discussion centered on the (surprisingly) disruptive effect of the iPhone transition. Surprising since most analysts, myself included, were lulled into thinking that the portfolio of iPhones and their wider distribution would create a smoother sales pattern vis-a-vis the more cyclical pattern seen in the first three years of production.

The second quarter was surprisingly strong and the third was surprisingly weak. So how do we estimate the fourth? Continue reading “Estimates for Apple's first fiscal 2012 quarter”

How productive is an Apple store employee?

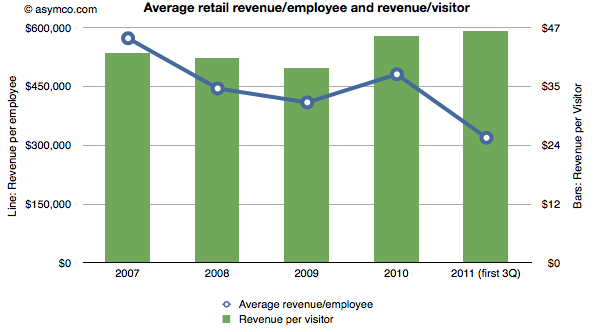
Apple publishes data about its “retail segment” which ifoAppleStore.com catalogs. Here are some statistics I was able to compute from the data:

  • The stores generate over $100k per employee per quarter. In 2010, revenue was $481,000 per employee. This year the average is around $320k excluding the fourth quarter. In 2009 the average revenue for the technology sector was $388k/yr. A retailer like JC Penney generates about $124k of revenue per year per employee.
  • The revenue per visit is around $45. There are well over 250 million visits per year (222 million for first three quarters of 2011).

The combination of these two metrics are shown in the following chart:

Will Windows Phone get to compete with non-consumption?

Before diving into the answer to the question in the title, there is some new data to digest.

The latest from comScore shows consistency with the previous months of smartphone growth in the US.

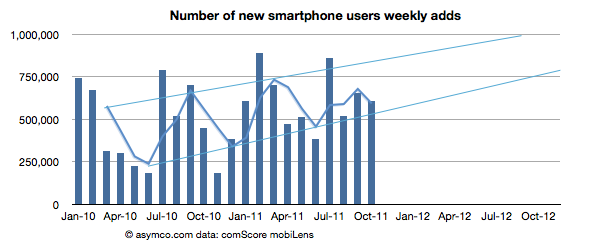
  • The growth rate was 607k/wk new-to-smartphone users. This is slightly down from 654k/wk for the previous month but up significantly from 450k/wk the year before.
  • The penetration of smartphones reached 38.5% (non-smartphones are at 62%)
  • The penetration should reach 50% before September 2012 with about 1.2% being converted every month.

The following chart shows the weekly add rate with a three-period moving average:

This chart is important in that it should first show signs of inflection in growth. Continue reading “Will Windows Phone get to compete with non-consumption?”

Android vs. iPhone

It has no price and hence there are no ways markets can signal demand or value creation. Furthermore, Android is not being offered to users like the iPhone. Android’s “customers” are phone vendors who package the software with additional value-added hardware and sell the combination to operators or distributors who then package it further with services and offer the total to end users.

So obviously, comparisons between Android and iPhone center on instances of Android used in real products and the “market performance” of Android therefore relies on these proxies for Android — the aggregate sum of products that have some form of Android in use.

I wrote this in response to a very short brief: “We’re looking for an editorial piece that comes down on either side of the debate of iPhone vs. Android”. The challenge I saw was on the approach to the question of “iPhone vs. Android”. I chose to measure value creation by the means available to shareholders.

Read more here: Horace Dediu Android Vs. iPhone on BusinessInsider.com

[I am posting this here in the hope that comments will accrue to this forum as well.]

5by5 | Mac Power Users #65: Workflows with Horace Dediu

(Note this is not the Critical Path, but a guest appearance on the sister show Mac Power Users.)

Episode #65 • December 5, 2011

Katie and David are joined by Asymco publisher Horace Dediu, who talks about how he researches and publishes his analysis of the mobile marketspace and his thoughts on the future of presentation tools.

via 5by5 | Mac Power Users #65: Workflows with Horace Dediu.

Asymco

Asymmetric Competition

Skip to content ↓