Apple's Income Statement at a glance

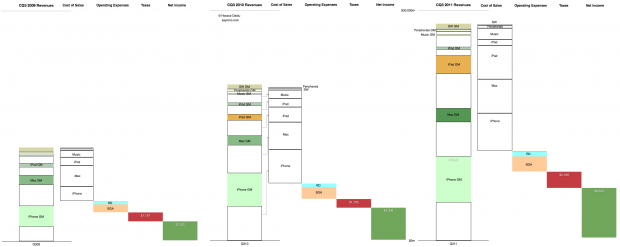
This is the cascading view of Apple’s financial performance in the third calendar quarter. It only includes information that is already in the income statement but shows the relative growth of the individual product lines, their cost structures and the relationship between fixed (Operating) expenses and their variable (cost of sales) expenses at a glance.

In the past I would publish current and year-ago data, but in this quarter’s summary I present three years’ history of quarterly data. Note that the full view is quite large (2,220 x 886 pixels).

Here are some handy tips on how to read the chart:

  • The “top line” is the size of the first column in each quarter’s chart.
  • The “bottom line” is the size of the last column.
  • The blank areas are what Apple pays suppliers.
  • The red area is what Apple pays to the government.
  • The Pink and pale blue area is what Apple pays its “exempt” employees. (Other Income and Expense is also included but is nearly invisible).
  • The Green area is what is declared as earned and becomes the “E” as part of the P/E ratio. (Note that not all of this goes to the Cash account as the cash flow statement will reveal).
  • The colored areas in the first column labeled with product name and “GM” (for gross margin) represent what Apple keeps from the sale of each product after paying expenses tied to producing that product.
  • The ratio of sold areas to the corresponding white areas below in the first column represent the margin (as a percent) per product line
  • You can observe the trend over three years by tracking each of these quantities from left to right.

The scale of the chart is shown by the line near the top representing $30 billion.

The US smartphone landscape

comScore published the latest data regarding US smartphone installed base. To summarize:

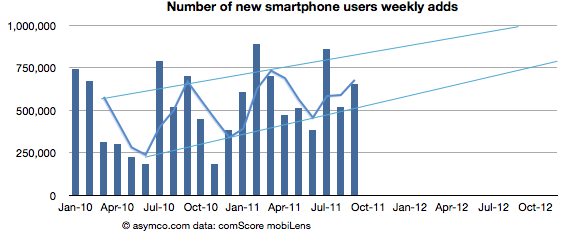
  • Penetration reached 37.4%, an increase of 2.9 million or 1.24 points of percentage.
  • Approximately 650k consumers switched from non-smart to smartphones every week during September
  • Based on trailing average of six months’ growth, 50% penetration will be reached by end of September 2012, though the trend is for accelerated adoption (see chart below).

Of the platforms available, Android reached Continue reading “The US smartphone landscape”

The end of the independent phone brand

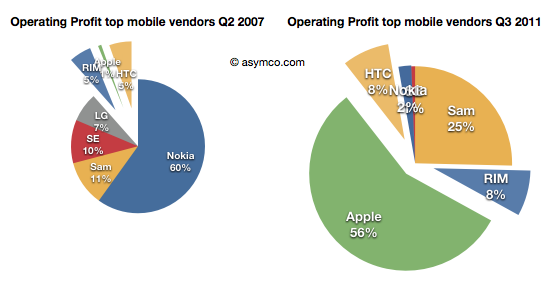
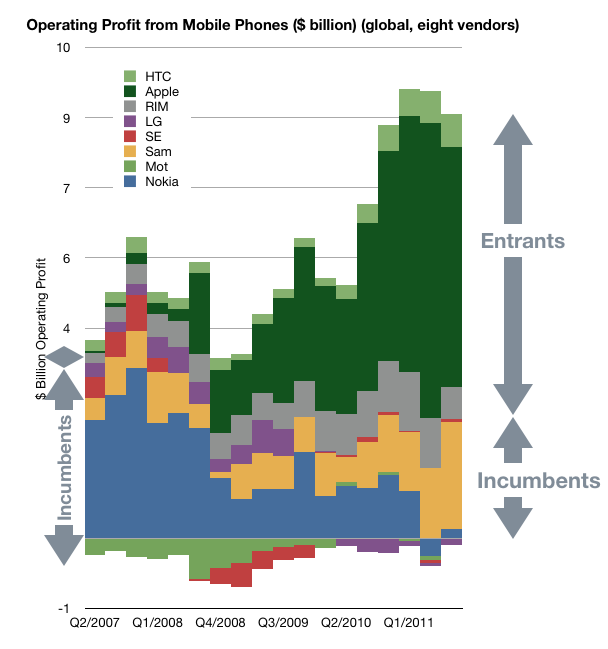
As shown in the yesterday’s post, in the third quarter, overall mobile phone profitability declined. The eight vendors I use as a proxy showed a total net profit of $8.51 billion, down slightly from $8.57 billion and a drop of $9.01 billion in the first quarter.

Overall, the industry dropped by 1% sequentially but is still up 30% over last year and has a 20% compounded growth rate over a three year period.

  • Nokia returned to profitability, though at $180 million it’s only about 2% of the top eight.
  • Motorola remained in the red with a small loss of $20 million, an improvement over the $90 million loss of the previous quarter. Motorola is being acquired by Google after an accumulated mobile operating loss of $4.69 billion since the beginning of 2007. It’s unlikely we’ll receive any updates on performance thereafter.
  • Samsung had a great quarter with a sequential increase of 19% and year-on-year growth of 130%. The total profit amounted to 25% of the peer group.
  • Sony Ericsson broke even with about $50 million in operating profit. Like Motorola its performance was barely break-even during the last four years and its also disappearing from our list of independent vendors as it becomes part of Sony.
  • LG had its sixth consecutive quarterly loss and is now appealing to investors for more capital to continue operating as a smartphone vendor. Raising dilutive capital seems a radical approach and not one that inspires confidence.
  • RIM had a sequential reduction in profit of 35% and y/y reduction of 30%. The company is exhibiting clear signs of decay and the stock market is valuing the company below book value.
  • Apple profit dropped by 19% but grew 43% y/y during a transitional quarter. The growth remains 43% compounded over three years.
  • HTC has a 1% sequential increase but a 78% y/y growth.

To illustrate the performance in terms of profit, pricing, volumes and margins, I developed the following chart.  Continue reading “The end of the independent phone brand”

Revolutionary User Interfaces

A few years ago, around the middle of the last decade, the mobile phone market was characterized by the rivalry between a few established vendors. These were Nokia, Samsung, LG, Motorola and Sony Ericsson. These incumbent companies had a broad portfolio of devices including smartphones and feature phones and basic phones. Many also sold networking equipment and were deeply engaged with their customers, network operators.

There was also a set of entrants who offered only smartphones.  They were quirky. HTC was a a prominent “ODM” or original design manufacturer who built phones for companies who added their brands and sold and supported the product. HTC made phones and PDAs for operator brands and for some large PC companies. It also began to sell phones under its own brand. RIM was also offering products that had evolved from pagers into email appliances with added voice capabilities. But RIM’s products were not very good as phones. Voice was so poorly integrated that many people carried both a BlackBerry and a voice phone. Then there was Palm with something called a Treo which promised many things but did not quite deliver.

In 2007 something happened which changed the industry. It took a few years to even realize it was happening but by the time it was obvious, it had changed to such a degree that huge companies found themselves in financial distress. This chart illustrates the effect.

In a few short years Continue reading “Revolutionary User Interfaces”

5by5 | The Critical Path #12: Back to the Future

Episode #12 • November 2, 2011 at 5:00pm

Dan and Horace talk about the tension between relying on data and using intuition to make strategy decisions. We also apply this dual approach to think through the next evolution of user interaction and the jobs we might hire mobile computers to do for us.

via 5by5 | The Critical Path #12: Back to the Future.

Dirk tweets an alternate description:

“The iPhone prepaid availability is not the key to emerging market. It’s Siri suiting high illiteracy rates.”

Regarding the title: Asymco in DeLorean | Flickr – Photo Sharing!


Apple Investor Summit

This is a quick note that I’ll be speaking at the Apple Investor Summit, March 15-16, at the Los Angeles Convention Center. My topic will be the analysis of Apple’s capital structure for strategic insight.

Apple co-founder Steve Wozniak and Walter Isaacson, Steve Jobs’ Biographer, will be keynote speakers.

The organizers are offering a Friends, Family & Followers VIP discount pre-sale from today until Friday, November 4th. Go to www.appleinvestorsummit.com to register at the discounted rate and check out the other speakers.


Apple's Residual Enterprise Value is less than 7x Earnings

In his third “The Critical Path” podcast, Horace Dediu explained how Apple’s cash can be viewed as a strategic option, an opinion that resonated also with other analysts [1]. Cash is one of the most flexible resources as it can convert quickly into other resources such as brands, companies, technologies, people and even processes. More cash means more strategic flexibility. The large cash reserve Apple has accumulated provides high flexibility for future investments. These characteristics of cash already imply an intrinsic option value. But how big is this value?

Calculating Option Value

To help us determine, I will apply the Black-Scholes model. Continue reading “Apple's Residual Enterprise Value is less than 7x Earnings”

Estimating Samsung's smartphone mix

Samsung no longer reports mobile phone shipments. The company’s phone market performance reporting is limited to the following:

Shipment : High-20%↑YoY (low-20%↑QoQ)

ASP : Slight increase QoQ

As the company did not report volumes or ASP last quarter either, the QoQ (Quarter on Quarter) growth estimates are almost useless. The only fragment that might be useful is the “High-20% YoY” given that they did publish units for Q3 2010: 71.4 million. This leaves the question of what “High-20%” means. Here are some ranges and what the result would be:

  • 92.1 million assuming 29% YoY growth
  • 91.4 million assuming 28%
  • 90.1 million assuming 27%

Continue reading “Estimating Samsung's smartphone mix”

Assessing the Smart TV Opportunity

There has been increasing chatter about a new TV being developed by Apple.

My opinion on the subject was summarized in the post called Tele Vision. I contend that a TV cannot be smart until the content it delivers becomes smart. The logical conclusion is that the value chain needs re-integration so that the component which is not good enough (the content) can be improved along the dimensions that users value. And it cannot be improved unless the direction it needs to go into is aligned with the direction of the disruptive innovator. I won’t repeat the theory here, but it suffices to say that whatever will change television will do so by re-defining the core product not just the tools we use to consume it.

But today I wanted to address another question: how do we value the opportunity? In a back-of-the-envelope manner, can we tell if this business is big enough to try to fix.

The answer depends a lot on the business model of the disruptive entrant. The entry could depend on software or advertising or hardware or distribution, and each would have a different valuation.

But for the sake of calibration, I want to start with a proxy. The basic question of how many “terminals” exist to the value networks. How many units of TVs are sold and how many could a new entrant convert to a new paradigm?

I prepared the following chart showing the world-wide TV market with a highlighted subset of so-called “smart TVs” (source TRi). The market is shown from 2010 actuals through 2014 estimates. To make it more interesting I also added similar data for two other markets. Mobile phones and PCs with their own sub-categories of smartphones and tablets as equivalent “high growth” opportunities.

When considering the opportunity, the Smart TV volumes are small relative to either tablets or smartphones. Continue reading “Assessing the Smart TV Opportunity”

Asymco

Asymmetric Competition

Skip to content ↓