How much does an Apple store cost?

Apple loves to talk about its stores. They do it in every conference call, keynote event and SEC filing. There is a monotony with the repetition of how many they have and how many they are building and how pretty they are. They start to seem like commodities.

But if they were commodities why aren’t there any other networks of successful “vendor stores”?

The answer is partly in the odd integrated business model Apple maintains asymmetric to every other modular technology provider. Apple seems to want to control the relationship with the buyer. It’s also partly in the uniqueness of design, an obsession with the brand. But still, that does not explain why can’t it be copied.

The answer is in the economics.

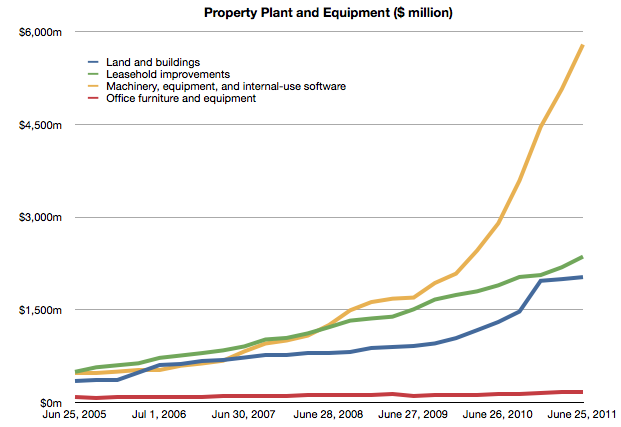
To understand the cost of developing an Apple store, we turn again to the balance sheet. Fortunately for us, Apple reports details of a particular asset called “Leasehold Improvements.” It’s a substantial asset worth over $2.3 billion in the last statement. It represents “alterations made to rental premises in order to customize it for the specific needs of a tenant.”

The following chart shows the change in that figure quarter-over-quarter.

Can we tie these expenditures directly to stores? Continue reading “How much does an Apple store cost?”

The down payment on iCloud

Balance Sheets are not typical targets of focus in software or services or “high tech” companies. Except for Cash, there are usually not much in terms of assets for analysts to contemplate. With outsourced manufacturing, even hardware companies don’t maintain depreciable assets on their books.

Apple, as usual, is different. It turns out there is a lot there and there’s a lot to learn from what’s there. I’ve looked at the Cash and Long Term Securities in the past but in the next few posts I’ll dive into fixed (non-current) assets. Specifically Apple’s Property, Plant and Equipment.

Apple Inc. has selected North Carolina as the location for a new data center and will invest more than $1 billion in the project over nine years, Gov. Bev Perdue announced

via It’s Official: Apple iDataCenter to North Carolina » Data Center Knowledge.

When Apple committed to the North Carolina data center in mid-2009 the iPhone was two years old. Only 26 million iPhones had been sold to date (about as many as Apple now sells every quarter.) Clearly if the commitment was on such a scale there must have been a plan. A big plan.

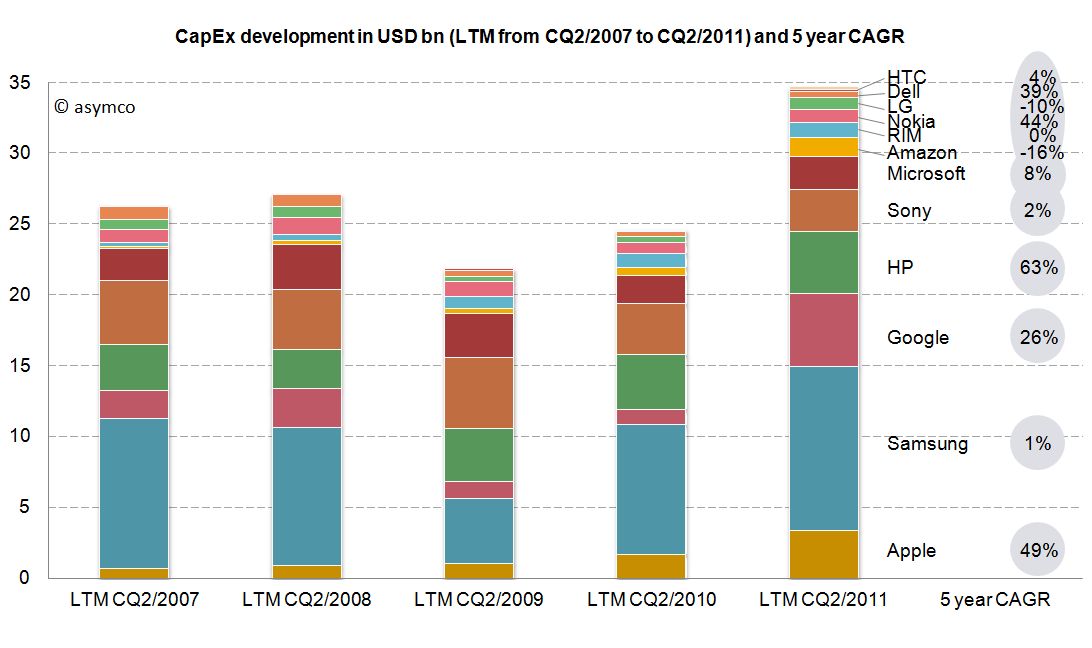
We don’t know for sure if NC was used last week or whether it was handling only part of the load, but let’s assume it was. What I want to think about is how much iCloud would thus cost and hence what would be the cost for alternative providers of such a service. That analysis might let us determine if “cloud” forms a substantial barrier to entry for competitors.

Beside the public statement above (which may have been designed for political benefit) can we find any evidence of what Apple spent on data centers? That’s where the PP&E line comes in.

The following chart shows the Property, Plant and Equipment asset in Apple’s Balance Sheet.


Each line represents a particular type of asset and its value at a particular point in time. I will now pay attention to the blue line, Continue reading “The down payment on iCloud”

More media tablet hype

The iPad is still only slightly more than a year and a half old. Forecasting unit volumes has proven very difficult. But more than that it’s proven very difficult to appreciate the impact on the market it’s disrupting, PCs.

For some people this is obvious, but what if you don’t live and breathe disruptive theory? What if you don’t watch every data source like a hawk for hints of change? What if you are not even a technologist. How would you form an opinion on the effect of the iPad on PCs?

There are many industries and sectors about which I know nothing. If you asked me to analyze a market like industrial lubricants, I’d probably start by reading the consensus opinion put forward by the leading market analyst, an expert in that particular sector. That would form the baseline.

In the PC sector, that opinion is formed by Gartner (and IDC and Forrester perhaps). Gartner will get a lot of citations and its stats and opinion forms the baseline view. It may not be right, but we can expect it to be the “consensus”. This is because Gartner surveys a lot of data and interacts with a lot of insiders in the industry. They collect and weigh these inputs and put out what is likely to balance them all.

If Gartner says that the iPad is a “media tablet” that is not a PC they may be wrong. But they are also repeating what the PC industry is saying. So I value Gartner as a reflection of the consensus. If there is a significant gap between Gartner and what I conclude to be reality then there is an interesting opportunity as well as evidence of incumbent ignorance.

Let’s then look back on how Gartner has been reporting the iPad’s rise and the PC’s decline.[1] Continue reading “More media tablet hype”

Windows Phone, a year on

Windows Phone is in limbo. The company acknowledged that it has performed below expectations. During the last quarter for which we have data (ending June) I have an estimate that Windows Phone sold only 1.4 million units (Gartner’s sell-through analysis suggests 1.7 million). That gives Microsoft a 1.3% share of units sold (Gartner 1.6%), a new low.

At the same time, comScore data shows Continue reading “Windows Phone, a year on”

How many iPhones will be upgraded next year?

Last week I proposed that there were two significant markets for the new iPhone: 1) the existing iPhone user base 2) smartphone “non-consumers”. Today I want to dig a bit deeper into the first market to get an idea of what it amounts to.

The following chart shows the total iPhone shipments over time with an estimate for the mix of models during the last two years.

The way I calibrated the mix is by taking into account the statement that Tim Cook made Continue reading “How many iPhones will be upgraded next year?”

The new iPhone portfolio and implications on ASP

The iPhone portfolio is now larger than ever. It’s arguable that, for the first time, we can actually call it a portfolio vs. the [n, n-1] pair of products that’s been available to date. A year ago I even argued that the n-1 variant of iPhone was more of a cognitive illusion than a real alternative.

But that all changed last week. For the first time since launch, there is a real portfolio. The iPhone is now available as five different variants with 10 different price points. Prices and options may vary by country, but I took the US portfolio as the baseline and illustrated it:

Including all the pricing options It’s a very regular pattern. Continue reading “The new iPhone portfolio and implications on ASP”

Can the BlackBerry recover?

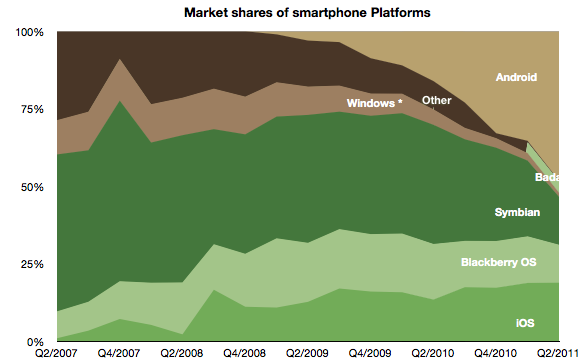
The August comScore mobile survey (MobiLens) is out. It measures the penetration or consumption of various mobile products and services in the US over a three month period.

I track the change in this data over time. Here are some highlights:

In August about 520,000 users switched to using smartphones (from non-smart phones) as their primary phone. This is a bit down sequentially from July but about average for the period starting January 2010.

Penetration increased by about 1 % to 36%.

Extrapolating this growth implies 50% penetration by September 2012. However growth is accelerating slightly so that tipping point may come sooner. Separately, T-Mobile reported that 75% of its device sales during this year have been smartphones, so if this is indicative of overall US market, then by next year it may in fact be quite difficult to find any non-smart phones to buy.

Among the smartphones, the different OSs have the following installed bases: Continue reading “Can the BlackBerry recover?”

Steve Jobs didn't

  • Steve Jobs did not create products. He created an organization that predictably and reliably created emotionally resonant products.
  • Steve Jobs did not make movies. He made a company that predictably and reliably made blockbusters.
  • Steve Jobs did not wrest market share from competitors. He created new markets that attracted and sustained competitors.
  • Steve Jobs did not design anything. He gave others the freedom to think about what jobs products are hired to do.
  • Steve Jobs did not re-engineer processes. He brought engineering processes to works of creativity and the creative process to engineering.
  • Steve Jobs did not develop new management theories. He showed by example that innovation can be managed.
  • Steve Jobs was not a visionary. He put the dots together and saw where they led.
  • Steve Jobs was not a futurist. He just built the future one piece at a time.
  • Steve Jobs did not distort reality. He spoke what he believed would become reality at a time when those beliefs seemed far fetched.
  • Steve Jobs was not charismatic. He spoke from the heart compelling others to follow him.
  • Steve Jobs was not a gifted orator. He spoke plainly.
  • Steve Jobs was not a magician. He practiced, a lot.

He had taste.
He was curious.
He was patient.
He was foolish.
He was hungry.

These things many others can do. Maybe you can.

At $2.9bn/yr apps are challenging songs as the most valuable online medium

During the October iPhone event Apple gave an update on the app and song download totals. This is a reliable gauge of the iTunes ecosystem performance and Apple has been supplying these numbers for several years.  Plotting these numbers gives us a good idea of the trend in mobile content consumption. Here is the data to date:

The total number of apps downloaded (excluding updates) overtook songs in June/July and continues on its trajectory. In fact, the rate of downloads for Apps is now over 1 billion / month. Given the data points above, I calculate it to be about 34 million per day. The corresponding rate for songs is 8.3 million per day.

You can see the rate of downloads as it’s changed over time here:

I used trailing four periods’ moving average for the lines to show the trend more clearly. The gap in download rates is large and increasing.

Now most observers would note that songs are much more expensive than apps, especially since there are no free songs and many apps are free. This would imply that the music business is probably more valuable than the app business.

That’s true, but not by much. To determine how much, I used the other data point offered: $3 billion in payments to developers. Since that represents 70% of gross revenues to Apple, we can determine that the average price per app is now 23.8c (down from 28.5c in April 2009)[1]. Knowing the app price we can plot both revenues and the margin that Apple keeps.

We can compare that with the margin that Apple keeps from songs (assuming a price point of $1.2 per song and a 73% pay-out to labels.)

The data jumps around quite a bit but the trend is pretty clear. After paying the content owners, iTunes is left with about $75 million per month from apps and $85 million per month from songs.

Apple then needs to pay other direct costs like credit card processing, bandwidth, storage, curation and testing. Then there are other operating expenses like R&D and marketing. These costs add up such that, according to Apple, they cover revenues, yielding a break-even operation.

Break-even or not, the way the data is trending it’s pretty clear that Apps will be responsible for a the majority of content cash flow at Apple.

At a billion downloads a month (and rising) the value in terms of revenues is already a run rate of $2.9 billion per year. This has been enough to overtake a business that has been running for more than seven years.

Notes:

  1. The payments to developers probably includes in-app purchases.

Asymco

Asymmetric Competition

Skip to content ↓