Wall St. discounts Apple's growth potential

Apple, with its $50 a share in cash, could earn as much as $17 to $20 a share in 2011, which means the stock is trading at a cheap 12.5 times next year’s earnings. Cramer said even if Apple hits his $300 target, the stock will still be cheap trading at just 15 times earnings.

“That’s less than almost every single growth stock I follow,” Cramer said, “and even less than the S&P 500’s multiple.”

via Jim Cramer Predicts Apple Inc. (NASDAQ:AAPL) will hit $300 a Share | Madd Money.

S&P forecasts the S&P 500 average P/E for 6/30/2010 at 22.57.

Readers of this blog may recall that I noticed Apple’s discounted valuation several times.

Who benefits from the shift from business to consumer drivers for technology?

Consumer tastes have overtaken the needs of business as the leading force shaping technology.

via New King of Technology – Apple Overtakes Microsoft – NYTimes.com.

Why is it that other “consumer-oriented” companies like Sony, Nokia and Phillips have not benefitted from this shift?  As far as I can tell they are no better off (and sometimes quite a lot worse off) than Microsoft has been during this transition.

Clearly, although the paradigm did shift to consumers, simply being consumer focused is not enough to benefit from this shift.

Continue reading “Who benefits from the shift from business to consumer drivers for technology?”

Can Google buy consumer competitiveness? Can Apple be an ad giant?

Daniel Eran Dilger in fine form after Apple became the world’s largest technology company by market capitalization.

These days, Apple’s primary competitors have all fallen down on their knees while clutching their gutted bellies…

Who is left? Google, the paid search giant that backers hope will beat Apple in hardware and software platforms… despite Google being neither a hardware vendor (nor marketer nor retailer nor support provider) nor having any real experience in managing a software platform for consumers. Fans of Google suggest that the company will take on Apple by acquiring a competing version of everything Apple has built over the last decade: iTunes, a mobile platform, hardware expertise, user interface design savvy, development tools, and a user base.

The problem is, they don’t also foresee that Apple could compete against Google in its own home territory of ads.

via How Apple could slay Google at WWDC 2010 — RoughlyDrafted Magazine.

The key assumption in the “Google can buy anything Apple already has” is that of the three things that make up a company (resources, processes and priorities) the only thing cash can buy is resources, and, in the tech world, even those are fragile things with legs that can walk out the front door.

Continue reading “Can Google buy consumer competitiveness? Can Apple be an ad giant?”

Apple's R&D Efficiency

In fact it’s rumored that Apple brought the iPhone to market for a mere $150 million, doing so organically without acquisition outside of a touch gesture recognition company named FingerWorks.

This begs the question: how in the world did Apple grow the iPhone platform organically from zero into the most profitable cell phone business in the world with so little investment?

via Apple’s Incredible Efficient Growth.

Apple has always spent below the industry average for R&D.

Here are Apple’s trailing 9 quarters R&D as percent of sales:

3.42% 3.86% 2.59% 2.65% 3.51% 3.50% 2.93% 2.54% 3.16%

Nokia spends at least 10% of sales on R&D and Microsoft at least that much.

But these numbers are not as spectacular as the comment above that iPhone development cost was $150 million.  To date, the product has generated $31.4B in sales.

As the article points out, Apple spent $4.6B on R&D over the past four years and Microsoft spent 7x that or $31 billion. Cisco and Intel spent 4x.

Apple's Growth Scorecard

Apple’s growth and its disconnect with valuation has been a common theme on this blog. For another look at this conundrum I present here a table of Apple’s year on year sales growth by product line and its top and bottom lines.

I color coded the values so that a darker green signifies higher growth (and red, negative growth)

I call this the growth scorecard.

What does this scorecard say about the previous 24 months?

  • Earnings never grew slower than 30% for any quarter except for one quarter when the comp was ridiculously high at 155% (on the back of iPhone 3G launch).
  • Throughout the recession Apple grew sales.
  • The worst growth performance was on peripherals which is Apple’s smallest business
  • The fastest growth was the iPhone, now Apple’s largest business.
  • The iTunes store grew sales consistently throughout the previous 24 months.
  • Growth has been positive (green) across all lines for the past two quarters and has been accelerating.

My estimate for the current (June) quarter is that Net Sales will grow by 47% y/y and Earnings will grow by 60%.

Apple's Valuation Struggle

I don’t know how many times I can re-write this story but here goes another try.

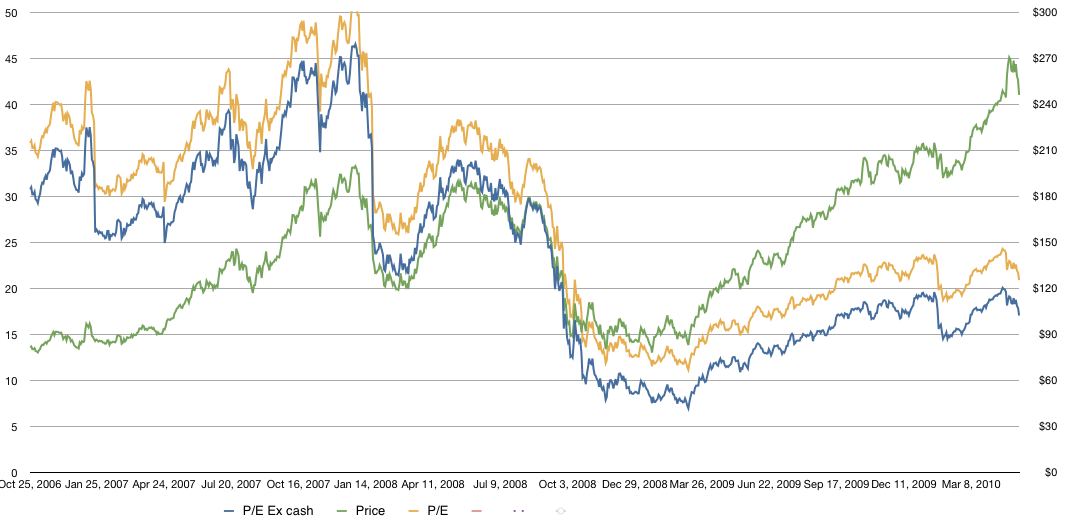
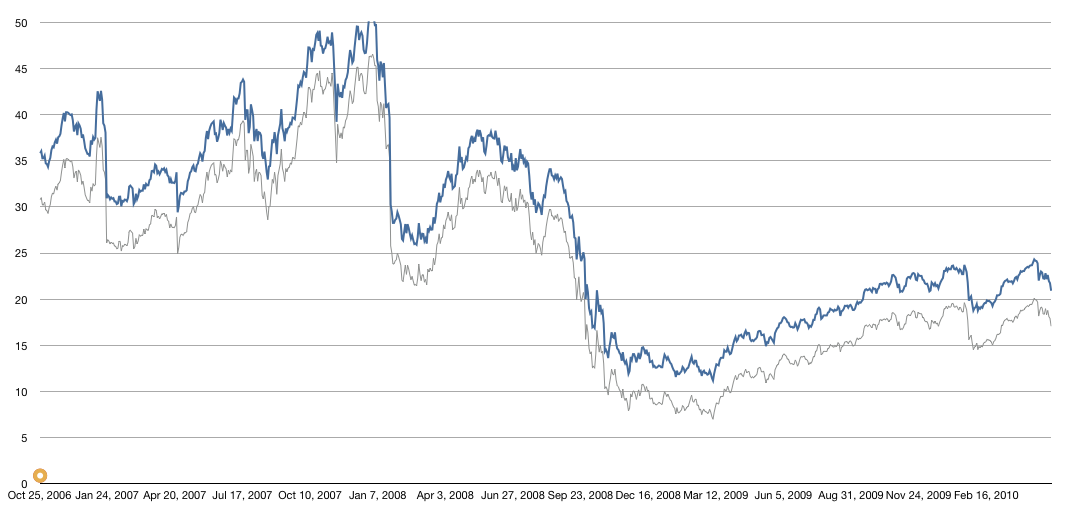
In the graph below I show Apple’s historic share price overlaid Apple’s P/E (with and without cash).

The share price is the line in green with the scale on the right and the P/E (trailing twelve months ex-cash) is shown in blue with the scale on the left.  The P/E including cash (which is what is usually cited) is shown in yellow.

As the graph shows, while the stock has risen, the P/E has fallen.  This is due to earnings accelerating faster than the stock price. As valuation is usually correlated with growth, it stands to reason that Apple continues to be discounted as a growth stock.

iPhone OS download rate 10X Blackberry

Today, Research in Motion co-CEO Jim Balsillie said his BlackBerry App World has 20 million registered users and nearly 1 million daily app downloads.

via Apple Doing 10-20X As Many App Downloads A Day As BlackBerry.

As previously stated, The App download rate increased to a record 10,753,000 per day during the last 90 days.  That makes the download rate for the iPhone platform 10x that of the Blackberry Platform.  The iPhone platform is nearing 100 million installed base.  Blackberry is citing 20 million registered users.  I think everyone is pretty clear on where this is going.

Apple Business Review: Cash Growth

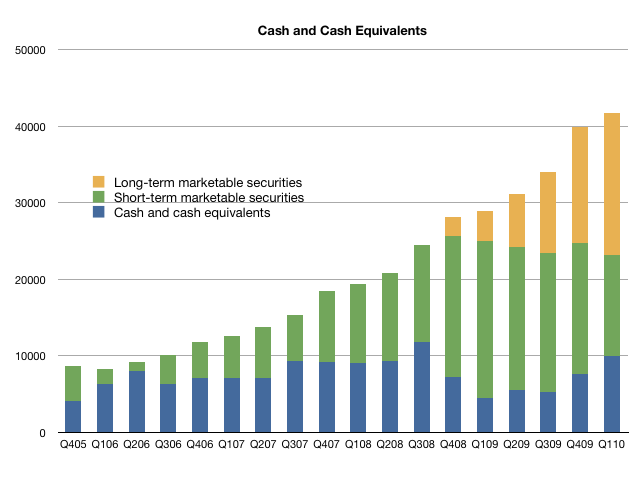
Apple’s cash continues to grow.  This quarter it reached $41.7 billion, a sequential increase of $1.9 billion.  This time last year, the cash was about $29 billion with a y/y increase of nearly $13 billion.  This is equivalent to $45.19 per share.

Many financial sites  report this figure incorrectly (e.g Yahoo finance with $24.8 billion) and are often cited by journalists.  This error is because Apple holds much of its cash in “Long-term marketable securities” and some choose to report only “short-term” holdings as cash.  Apple’s “Long-term” securities are the same as their “short-term” securities, namely US Treasury bonds.  The distinction is in the maturation date, not their liquidity.  Apple makes a clear statement of their cash position every quarter and highlights the composition of their holdings.

Note that more than one third of cash is currently in Long-term securities and exclusion of that item would indicate a decrease in Apple’s cash.

Note also that cash grows in a seasonal pattern. Q1 is typically the lowest growth, and Q4 the fastest.

The graph below shows Apple’s cash by security.