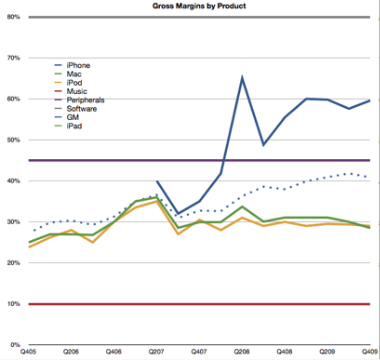
 Apple’s latest re-statement of financial statements eliminated subscription accounting for the iPhone not just for the past quarter but for the entire history of the product, back to mid-2007. This allows a more precise estimate of the gross margin of the product and the results are eye-watering.
Apple does not reveal the margin for any product. They do provide an overall margin for the company (shown in the dotted line above).
The only challenge is to “back into” the GM for iPhone based on what we know of the margins for the other product lines and filling in the iPhone as the last piece of the puzzle.
To do so, we need to have some idea of what the other products’ margins are. Fortunately, this is not that hard.
We start with the easiest and work up:
The Software products business line ($2.4 billion last year) is easily the most profitable on a unit basis as software does not require much cost in manufacturing. A solid ballpark estimate is 80% GM (which is what Microsoft typically gets.)
Next, Music ($4.2 billion revenues). The estimate for music is fairly straight-forward. Apple and the industry have leaked the terms many years ago. Apple pays the labels most of the revenue of the music and keeps about 10% to operate the store. On the App Store there is a 30% margin off the selling price but that is offset by higher direct costs (shipping billions of free apps and free updates). I stick with 10% margin for the Music business line.
Third, Peripherals. The peripherals business is not particularly large for Apple, but they do a fair amount of peripherals with $1.5 billion last year. My estimate for peripherals margin is 45% based on some comparables.
Fourth, the iPod ($8.1 billion). The iPod has had a fairly well understood cost structure. The main variable is the cost of the memory, which, as a commodity, varies greatly quarter to quarter. Nevertheless, there is a strong consensus that iPod margins have kept around 29% to 30% over a few years. Teardown analysis coupled with spot pricing for memory chips gives a consistent average.
Fifth, the Mac ($14.7 billion). The Mac is a difficult product to estimate margins for due to the relatively wide variety of SKUs in the market, the complex components, various quality/warranty issues, transportation costs and the point in the life cycle of any given Mac. The best estimates however hover around the same as the iPod: 30%.
Once these values are available, and knowing the proportion of sales attributable to the iPhone vs. the other products, we can get an estimate of the gross margin.
Recent GM estimates are all shown in the graph attached. Here are a few observations:
- The overall GM was tied very closely to the Mac/iPod prior to the iPhone.
- Gross Margin has been increasing since the iPhone
- The iPhone GM is consistently above 60% and is chiefly the reason for the increasing of the overall GM
The expanding margin for the whole of Apple is quite a story in itself (especially vis-a-vis the tragicomedy of the other PC vendors). However, what really stands out is how high the iPhone margin is.
Knowing why it stays so high in the face of an assault of “iKiller” devices is a clue to how Apple creates value.

